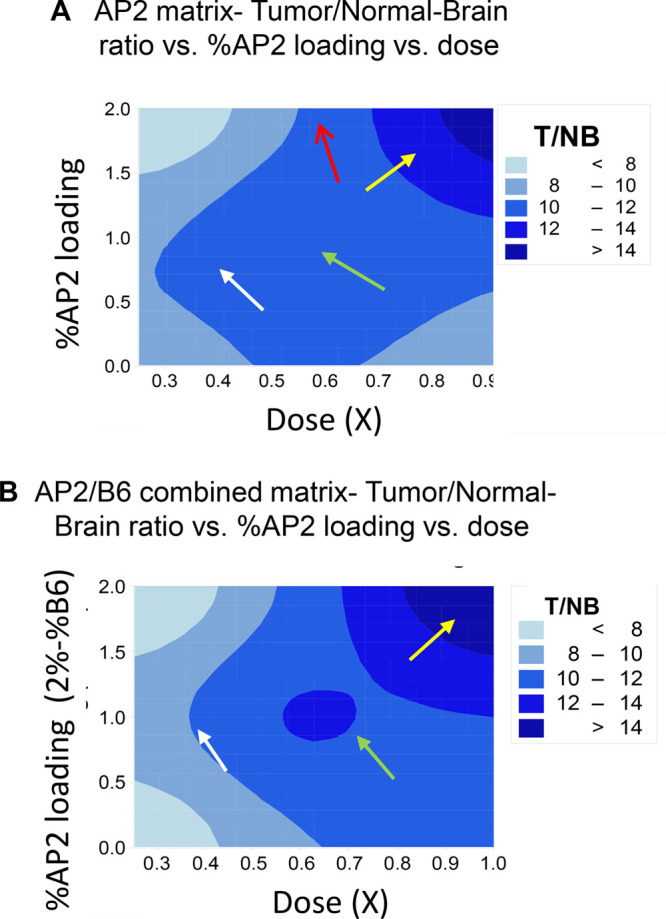
Figure 4.

Factorial study: 2D contour plots for the selectivity response T/NB ratio (dosage is shown on X-axis, % AP2 loading is shown on Y-axis, and T/NB ratio is shown on Z-axis). (A) represents the single peptide-matrix (P/LLL/AP2), and (B) represents the combined peptide-matrix (P/LLL/AP2/B6). For more details, see Supporting Information.
