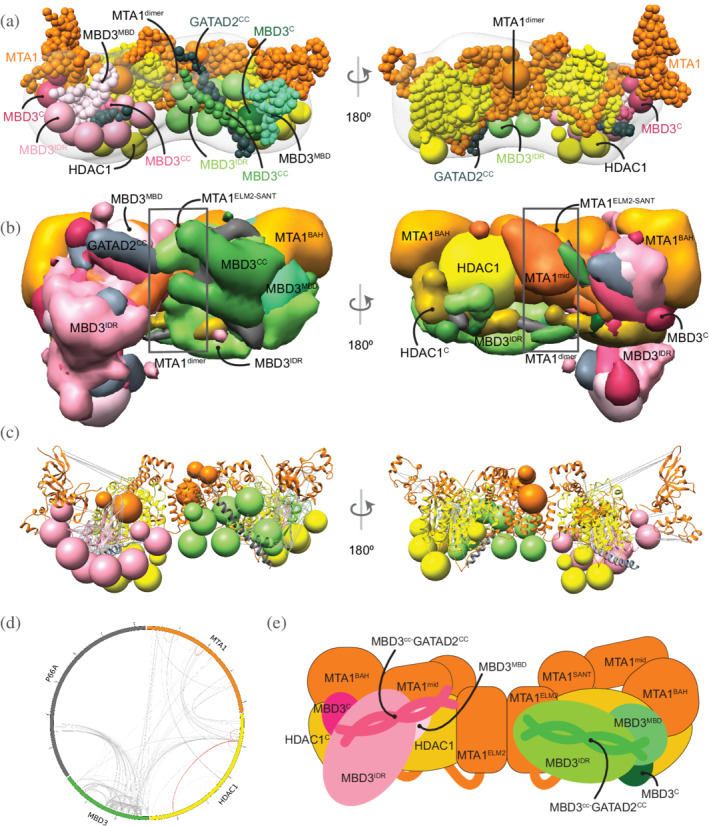
FIGURE 4.

Integrative model of the MTA1N‐HDAC1‐MBD3GATAD2CC (MHM) complex. (a) Representative bead model from the major cluster of analyzed integrative models for the MHM complex, with the corresponding EM map (EMD‐21382), 12 colored by subunit. The domains of the two MBD3s are shown in shades of pink and green, respectively. (b) Localization probability density maps showing the position of different domains in the ensemble of models from the cluster. The domain densities are colored according to Figure 1. (c) The same density maps as (b) (front view), showing the two MBDs in pink and green, respectively, and illustrating that they localize differently on the MTA1‐HDAC1 dimer. The density maps of MTA1mid and GATAD2cc were omitted for clarity. (d) The density maps of the two MBD3IDR domains on the MTA1‐HDAC1 dimer. Most of the maps are contoured at around 20% of their respective maximum voxel values (except MTA1165–333 at 10% and GATAD2cc at 27%). (c) Representative bead model from panel (a) with regions of known structure shown in ribbon representation. (d) CX‐CIRCOS (http://cx‐circos.net/) plot for crosslinks satisfaction on the ensemble of MHM models from the major cluster. Gray (red) lines indicate satisfied (violated) crosslinks in panels (c) and (d). (e) Schematic representation of the integrative model of the MHM complex. Note that MTA1mid in this model corresponds to MTA1334–431. See also Figure 1 and Figures S3 and S6
