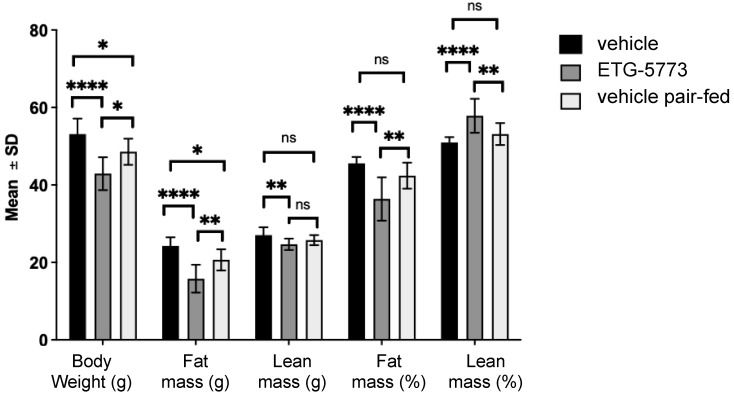
Figure 4.
Body composition analysis in DIO mice treated with ETG-5773. The graph shows changes in absolute body weight, fat mass, and lean mass of mice after 22 days of treatment as well as relative amounts of fat and lean mass. Animals were treated orally twice a day with 15 mg/kg ETG-5773 or with the corresponding vehicle for vehicle or pair-fed groups. * p < 0.05, ** p < 0.01, **** p < 0.0001, ns: non-significant. ANOVA mean SD, n = 12 vehicle and ETG-5773, n = 8 pair-fed.

