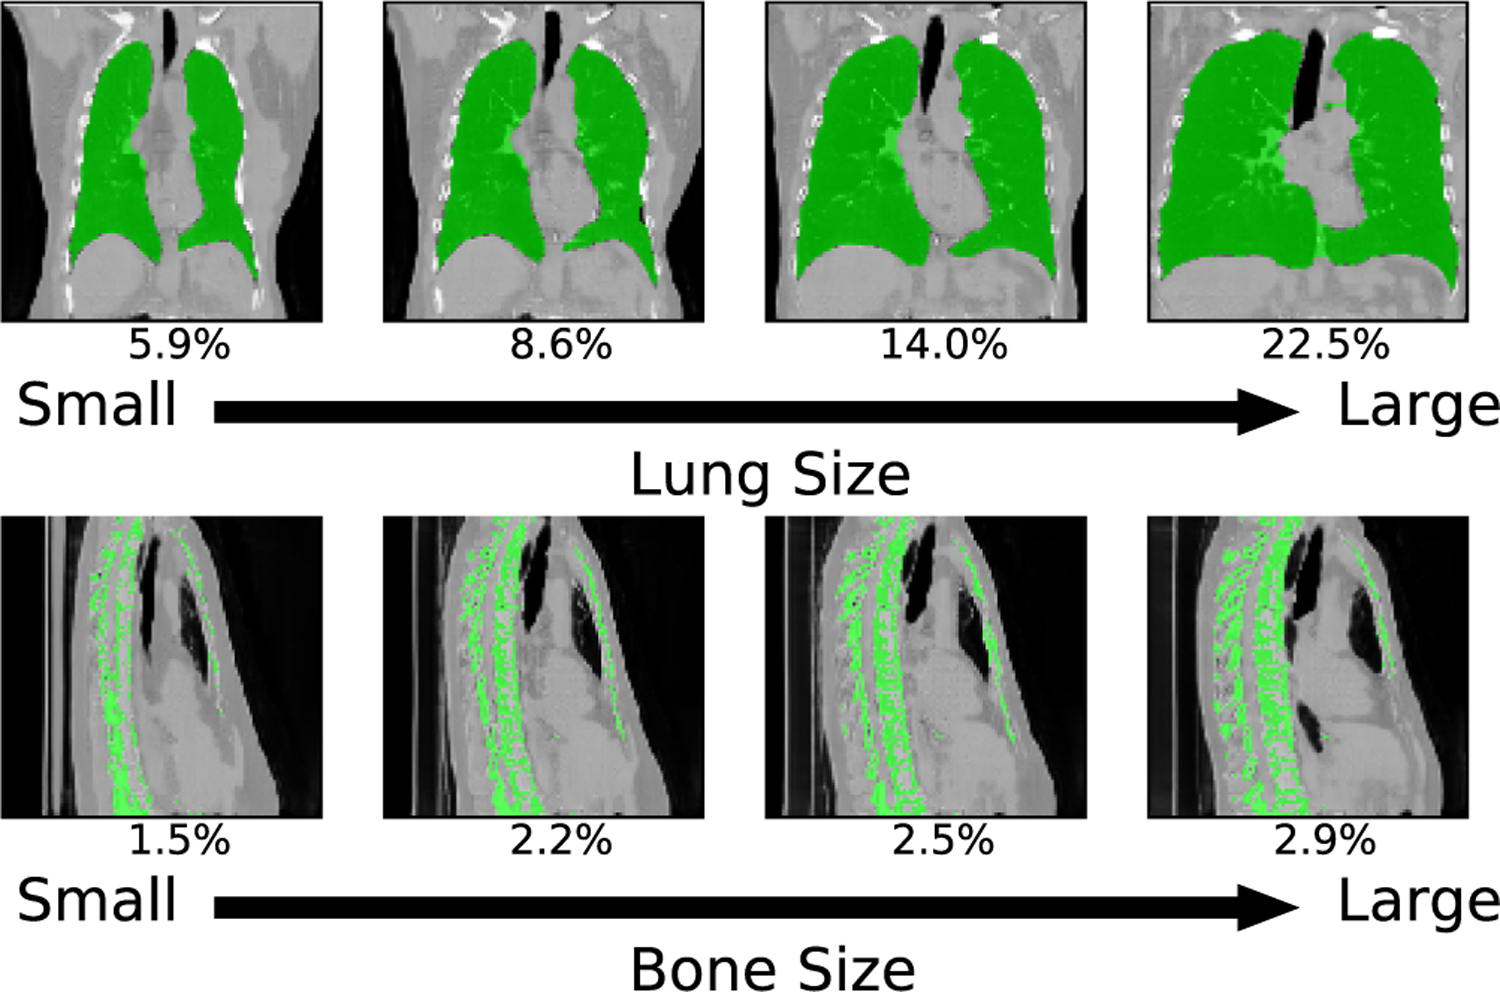
Fig. 5.

Latent space exploration on thorax CT images. The figure reports synthetic images generated by changing the latent code in two different directions, corresponding to the lung and bone volume respectively. The number shown below each slice indicates the percentage of the volume of interest that occupies the volume of lung region of the synthetic image. The segmentation masks are plotted in green.
