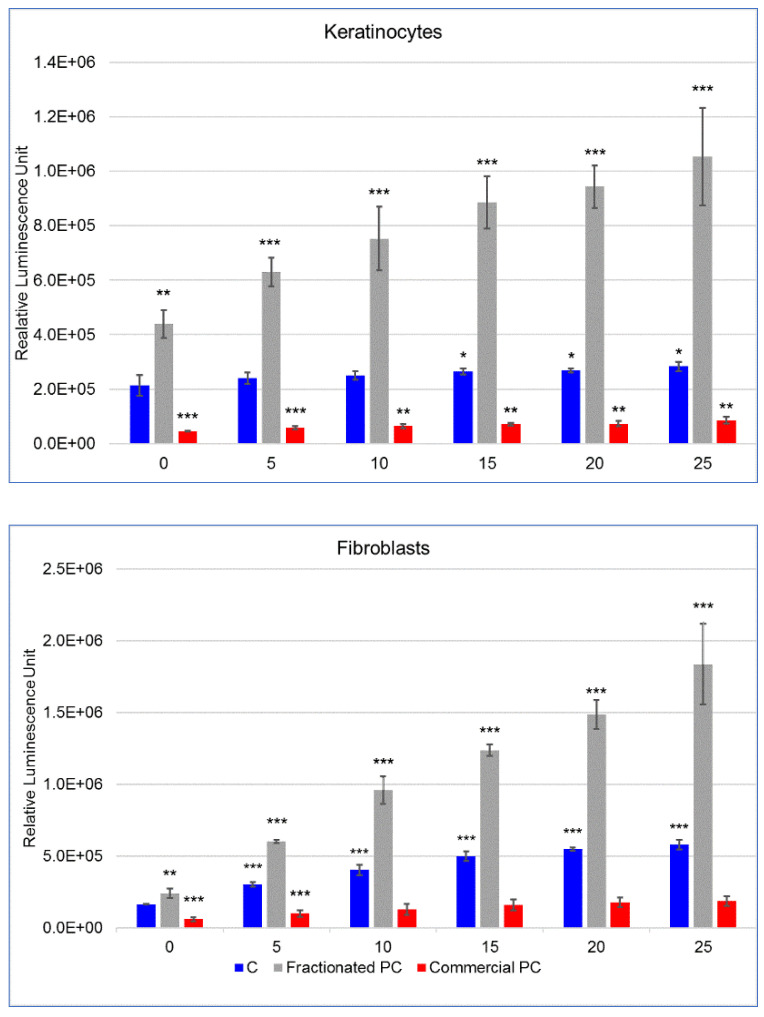
Figure 5.
The quantification of reactive oxygen species, expressed as relative luminescence units (mean ± SD) in human keratinocytes and fibroblasts. Control (C) cells and cells incubated for 24 h with a commercial phycocyanin (PC) and a PC fractionated from Arthrospira platensis were exposed to UVA for 5, 10, 15, 20, 25 min. Statistical differences were evaluated via Student’s t-test by comparing each treatment with control cells not exposed to UVA (0 min); the level of significance set at (***) p < 0.005, (**) p < 0.01 and (*) p < 0.1.

