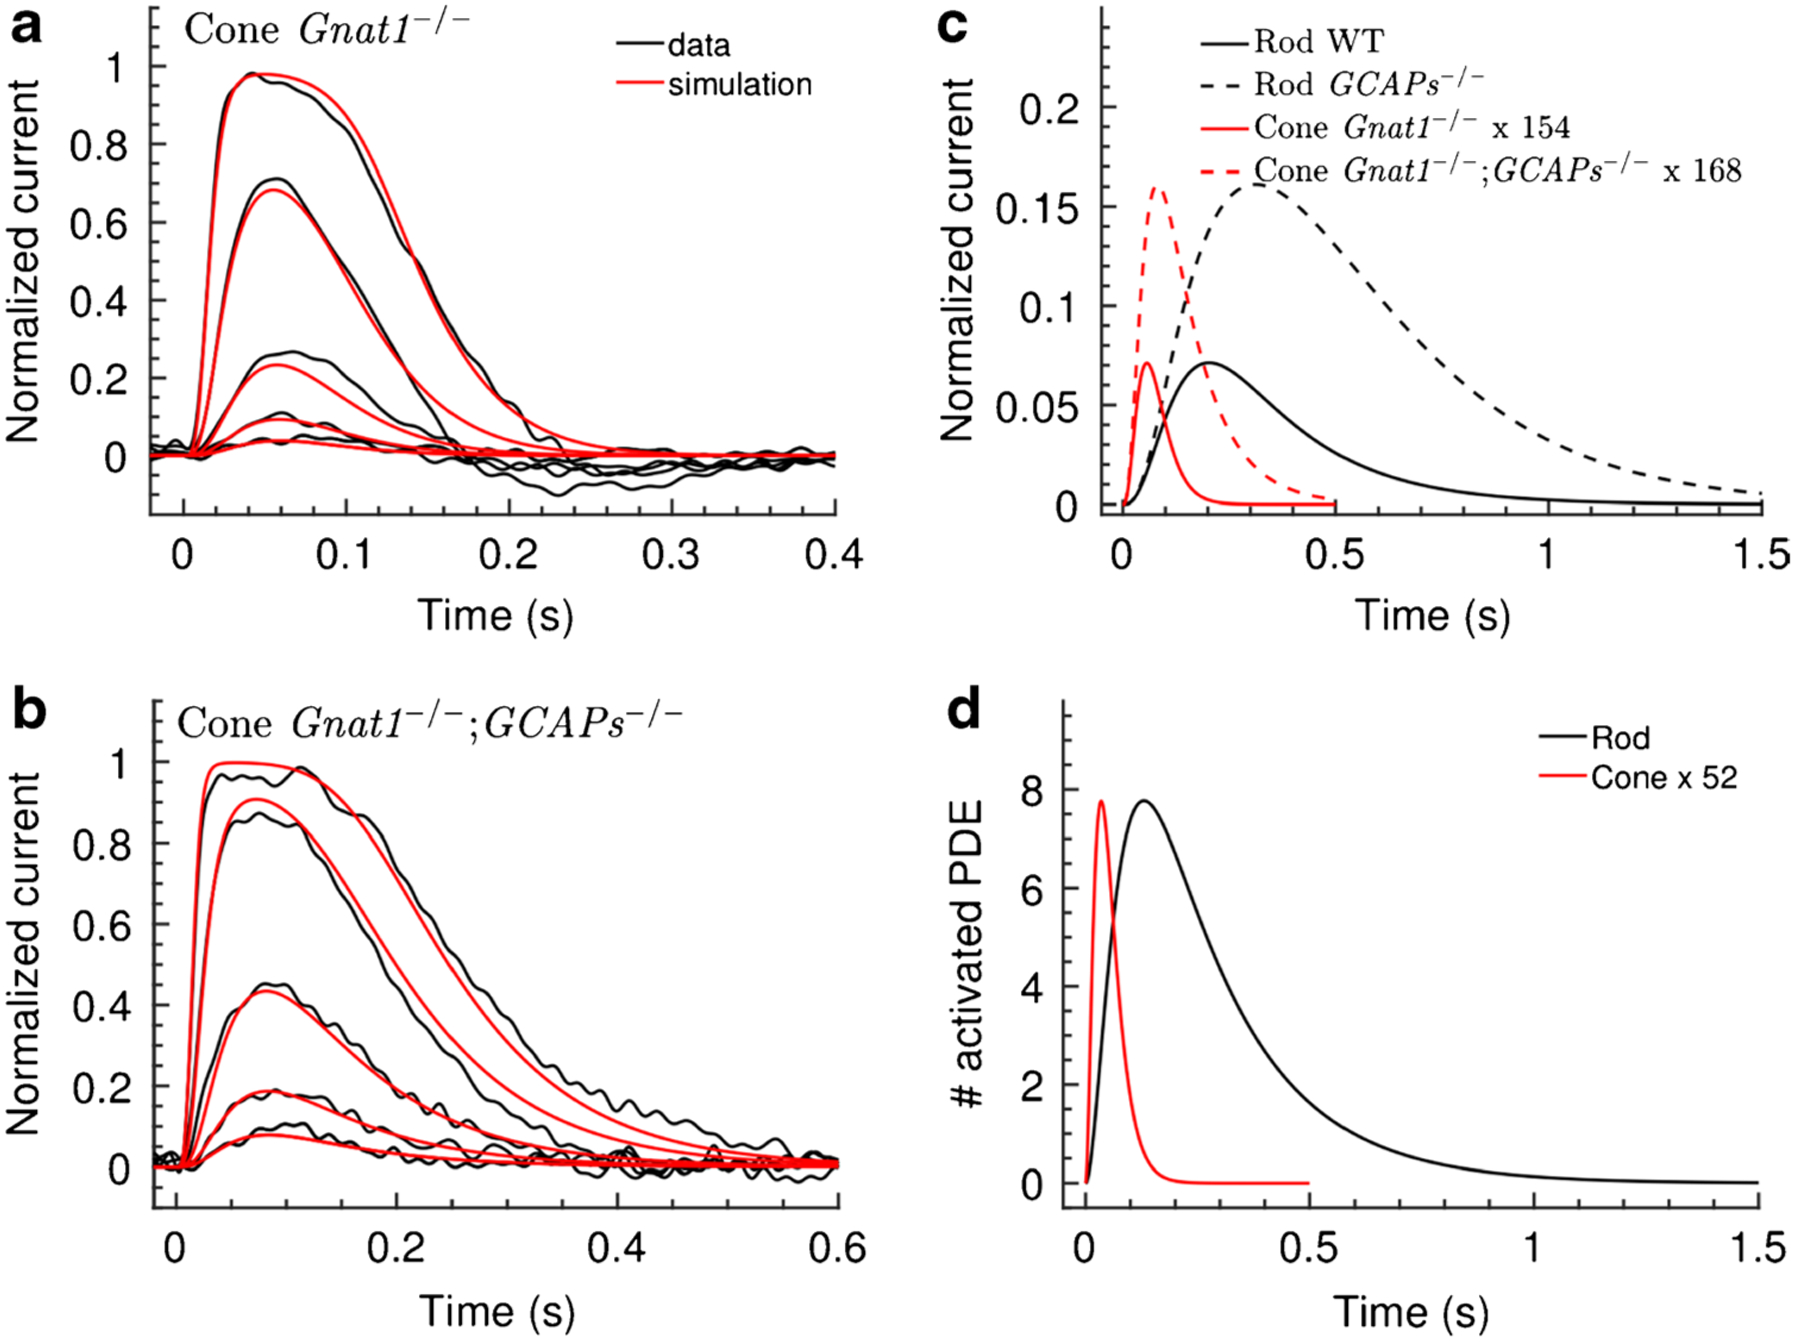
Fig. 2.

Model of mouse cone response. Black traces are responses from Gnat1−/− cones (a) and Gnat1−/−;GCAPs−/− cones (b). Recordings were made on a Gnat1−/− background to eliminate rod input. Thus, Gnat1−/− cones are essentially WT cones without rod input. Both sets of recordings were fitted concurrently by altering the parameters of the rod model, and red traces are the best fits obtained by decreasing transduction gain, increasing dark cGMP turnover, and accelerating decay of light-activated PDE. c Calculated single-photon responses of WT and GCAPs−/− rods and cones. d Calculated number of PDEs activated by light as a function of time. PDE activation amplitude and kinetics are unaffected by the presence or absence of the GCAPs and are therefore the same for both Gnat1−/− and Gnat1−/−;GCAPs−/− cones. The indications x154 and x168 in c, and x52 in d, mean that displayed responses have been multiplied by the specified factor. From [97]
