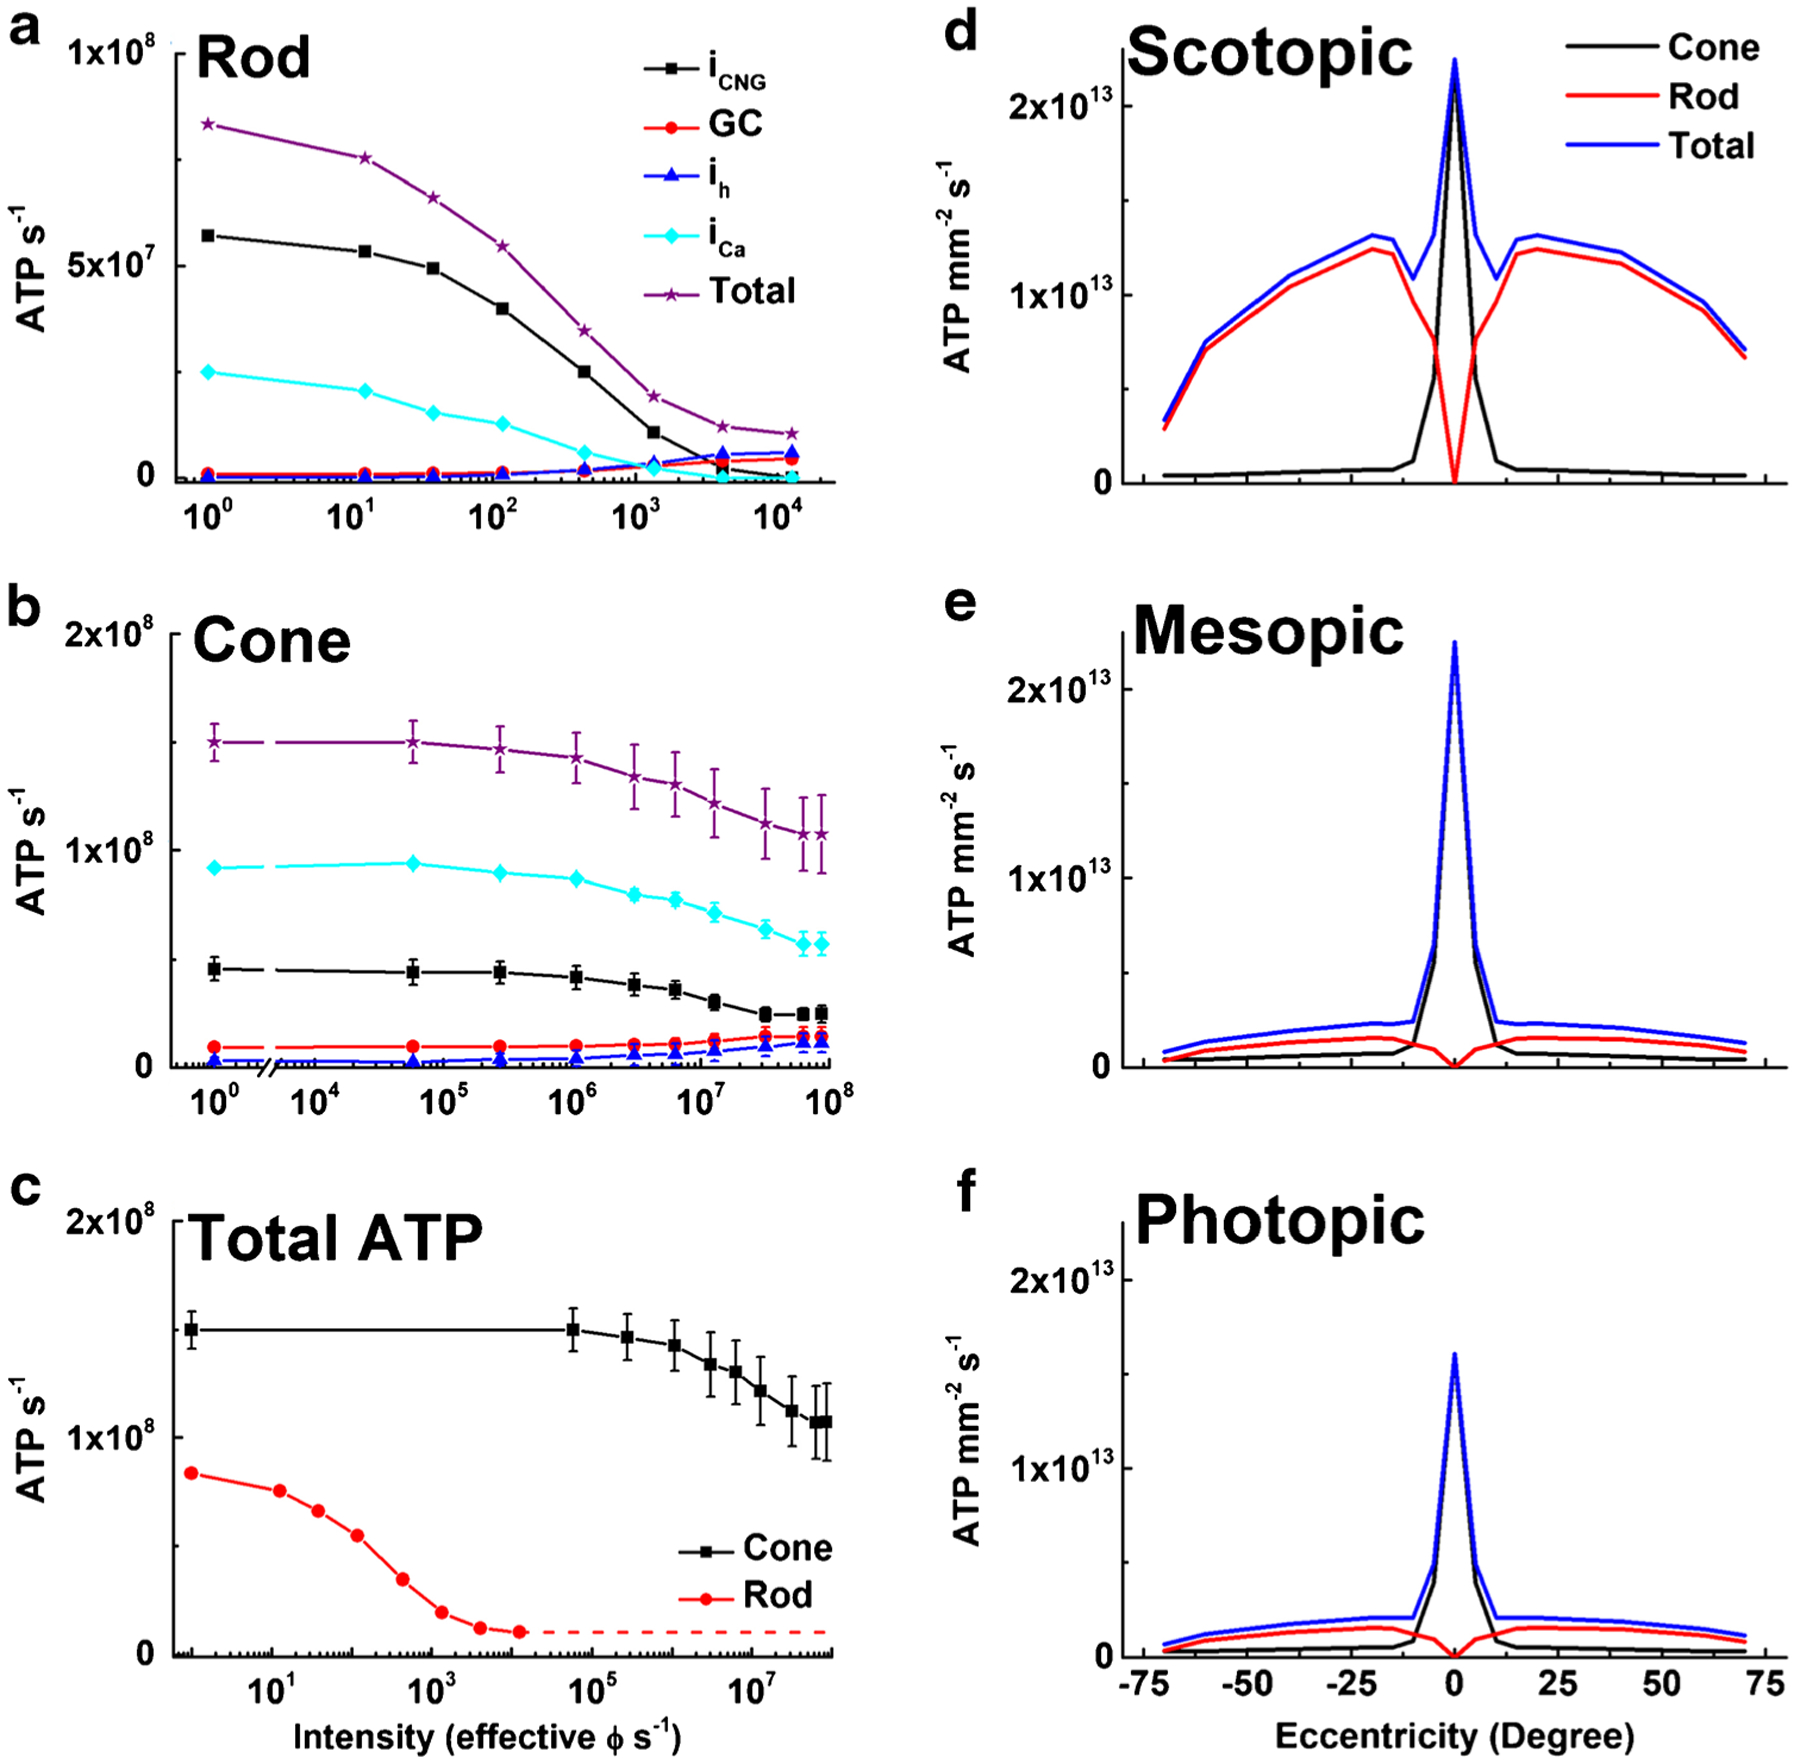
Fig. 6.

ATP consumption in rods and cones in steady light. Net ATP consumption for rods (a) and cones (b) as a function of light intensity in photons s−1, effective at the λmax of the rod or cone photopigments. ATP consumption was calculated from physiological measurements (see text) and is given as ATP consumed s−1 for CNG channels (iCNG, black squares), HCN channels (ih, blue triangles), Ca2+ influx at synaptic terminals (iCa, cyan diamonds), guanylyl cyclase (GC, red circles), and the sum of all four (Total, purple stars). c Total ATP consumed for rods (red) and cones (black). Data are means ± S.E.M. d–f Total ATP consumption for rods and cones as a function of retinal eccentricity for human retina, calculated from the data in part (c) and the density of photoreceptors [87]. Energy expenditure was calculated for three ambient light intensities: scotopic (d, darkness, 0 effective ϕ cell−1 s−1); mesopic (e, 12,600 effective ϕ rod−1 s−1 or 12,500 effective ϕ cone−1 s−1); and photopic (f, 8.8 × 10⁷ effective ϕ rod−1 s−1 or 8.7 × 10⁷ effective ϕ cone−1 s−1). We used mouse values for cone light–dependent currents, even though foveal cone outer segments are three times longer than mouse cones [21, 34] and likely have larger circulating currents. No attempt was made to take into consideration the difference in the number of synaptic ribbons in the pedicles between foveal and peripheral cones [28]
