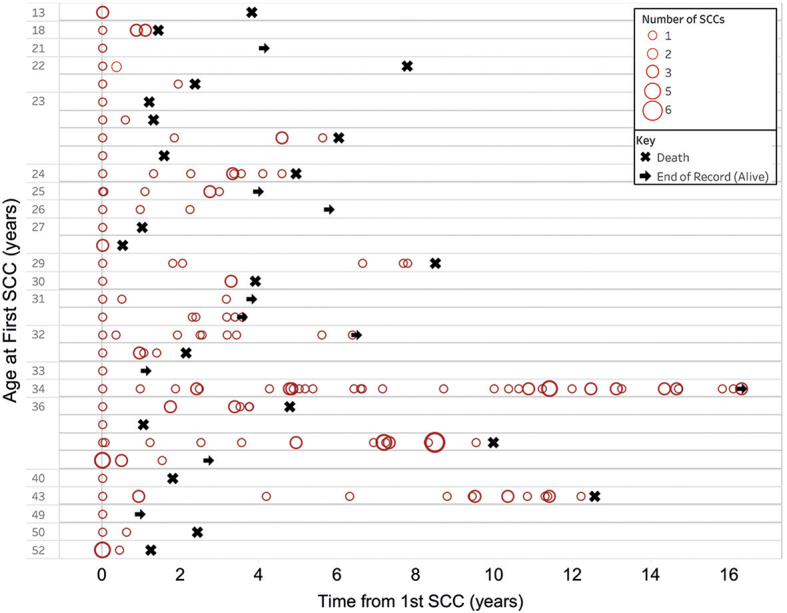
Fig. 2.

Temporal occurrence of squamous cell carcinomas (SCCs) in each patient with severe recessive dystrophic epidermolysis bullosa. Each patient is represented as a horizontal line showing the occurrence of their tumours from the age at first tumour denoted on the y-axis. The size of the circle denotes the number of SCCs diagnosed at each time point. In some patients there was a trend for developing greater numbers of tumours at shorter intervals over time.
