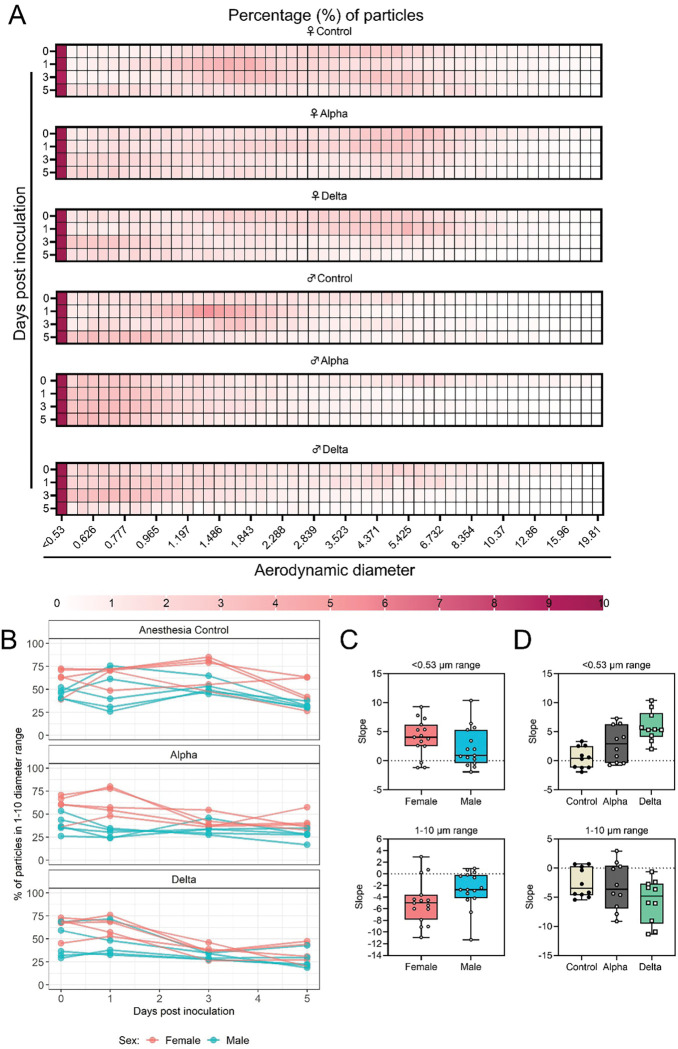
Figure 3: Aerodynamic particle analysis of SARS-CoV-2 infected hamsters.
A. Syrian hamsters were inoculated with 103 TCID50 via the intranasal route with Alpha or Delta. Aerodynamic diameter profile of exhaled particles was analyzed on day 0, 1, 3, and 5. Heatmap shows rounded median percent of total particles across groups, including the anesthesia control group (N = 10, comprising 5 males and 5 females). Colors refer to scale below. B. For each animal, line graph of the percent of particles in the 1–10 μm diameter range by variant group and sex indicated by color. C/D. Individual slopes for percent of particles in the <0.53 μm range (top) and 1–10 μm range (bottom) are presented by sex and variant group. Boxplots depict median, interquartile range, and range. Multiple linear regression performed for each diameter range with group and sex as predictors, F-statistic (3,26) = 9.47 for <0.53 μm model and F-statistic (3,26) = 2.62 for 1–10 μm model, with Tukey multiple comparison adjustment for the three variant-group comparisons (95% family-wise confidence level). For <0.53 range, Male-Female (estimate = −1.7, standard error = 0.888, two-sided p = 0.0659); Alpha-Control (estimate = 2.41, standard error = 1.09, two-sided p = 0.0874), Delta-Control (estimate = 5.40, standard error = 1.09, two-sided p = 0.0001), Delta-Alpha (estimate = 2.99, standard error = 1.09, two-sided p = 0.0280). For 1–10 range, Male-Female (estimate = 2.19, standard error = 1.23, two-sided p = 0.0875); Alpha-Control (estimate = −0.633, standard error = 1.51, two-sided p = 0.9079), Delta-Control (estimate = −3.098, standard error = 1.51, two-sided p = 0.1197), Delta-Alpha (estimate = −2.465, standard error = 1.51, two-sided p = 0.2498). Grey = Alpha, teal = Delta, beige = anesthesia control, red = female, blue = male.

