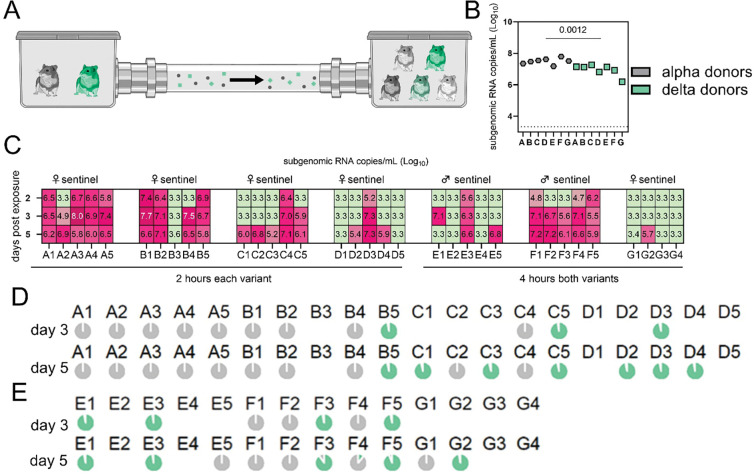
Figure 4. Airborne attack rate of Alpha and Delta SARS-CoV-2 variants.
Donor animals (N = 7) were inoculated with either the Alpha or Delta variant with 103 TCID50 via the intranasal route and paired together randomly (1:1 ratio) in 7 attack rate scenarios (A-G). To each pair of donors, one day after inoculation, 4–5 sentinels were exposed for a duration of 4 hours (i.e., hours 24–28 post inoculation) in an aerosol transmission set-up at 200 cm distance. A. Schematic figure of the transmission set-up. B. Day 1 sgRNA detected in oral swabs taken from each donor after exposure ended. Individuals are depicted. Wilcoxon test, N = 7. Grey = Alpha, teal = Delta inoculated donors. C. Respiratory shedding measured by viral load in oropharyngeal swabs; measured by sgRNA on day 2, 3, and 5 for each sentinel. Animals are grouped by scenario. Colors refer to legend on right. 3.3 = limit of quality. D/E. Percentage of Alpha and Delta detected in oropharyngeal swabs taken at day 2 and day 5 post exposure for each individual determined by deep sequencing. Pie-charts depict individual animals. Grey = Alpha, teal = Delta.

