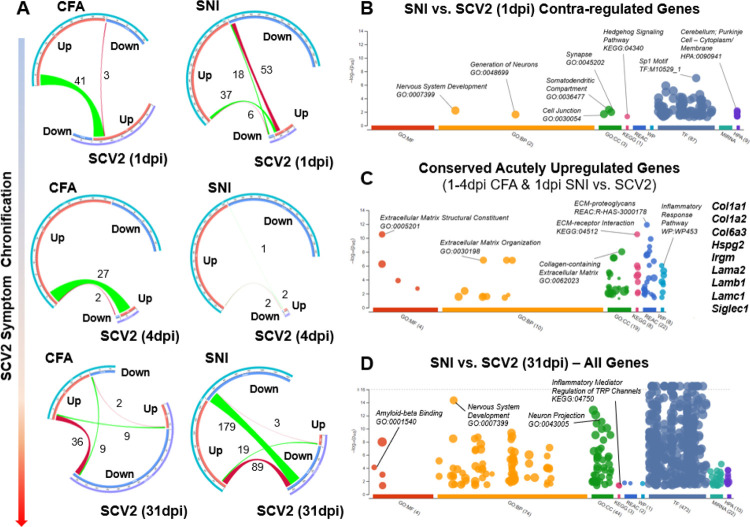
Figure 6. SARS-CoV-2 infection causes a longitudinally variable tDRG transcriptomic profile that shares pro-nociceptive components yet demonstrates unique plasticity signatures.
A) Chord diagrams demonstrating regulation of DRG gene expression changes between CFA, SNI, and SARS-CoV-2 (1, 4, and 31dpi) animals. B-D) Dot plots demonstrating significant Gene Ontology (GO; Molecular Function, Biological Process, Cellular Compartment), Kyoto Encyclopedia of Genes and Genomces (KEGG), Reactome (REAC), WikiPathways (WP), Transfac (TF), and Human Protein Atlas (HPA) (−log10p-adj.>1.3) for contra-regulated genes between SNI and 1dpi SARS-CoV-2, conserved upregulated genes for CFA/SNI vs 1–4dpi SARS-CoV-2 comparisons, and all commonly regulated genes between SNI & 31dpi SARS-CoV-2. Dot plots adapted from g:Profiler.

