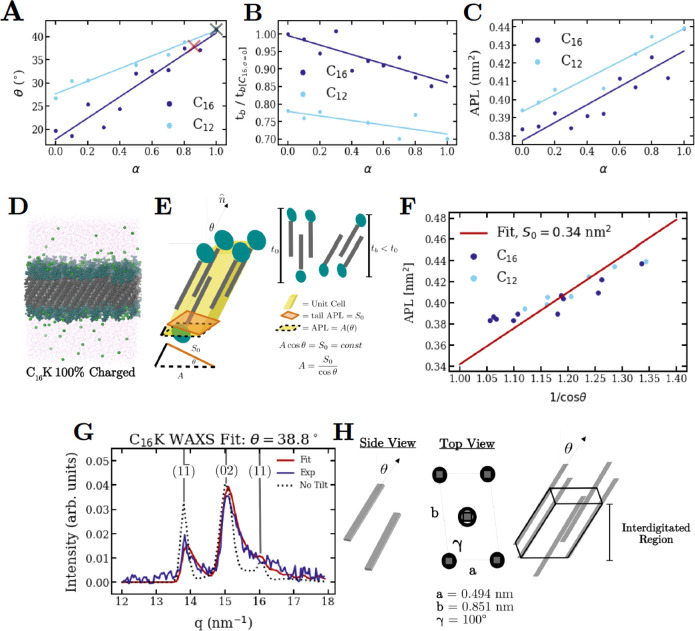
Figure 6.
(A) Molecular tilt angle with respect to the bilayer normal, (B) bilayer thickness, and (C) area/lipid/leaflet, for C16-K and C12-K bilayers at varying degrees of ionization. Bilayer thickness in (B) is normalized to the thickness of C16-K bilayers at α = 0. The navy and cyan lines in (A)–(C) are guides to the eye for MD data for C16-K and C12-K bilayers, respectively. (D) Simulation snapshot of a C16-K bilayer after 250 ns. Purple dots: water molecules; neon green: chloride counterions; green: headgroups; gray: tails. (E) Definitions for the bilayer parameters APL, S0, θ, and tb. (F) The APL vs 1/cos(θ) data for C16-K and C12-K bilayers collapses on a straight line through origin. This demonstrates the constancy of the area per lipid tail in the tilt-normal plane. (G) WAXS data for C16-K bilayers at pH = 4.5 (blue) and corresponding fit (red) based on the tail packing model of the interdigitated region and oblique lattice shown in (H). Miller indices for the diffraction peaks are labeled in gray.

