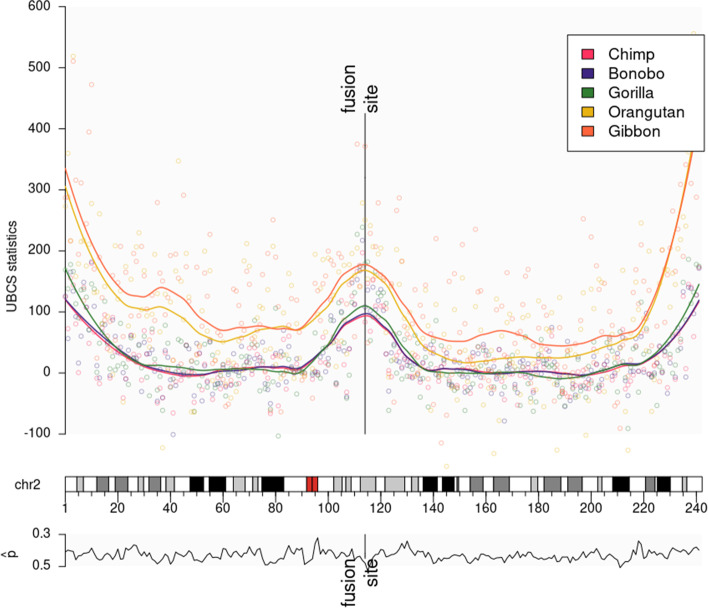
Fig. 2.
UBCS statistic for human chromosome 2 and Great Ape genomes. (Top panel) UBCS statistic for substitutions derived in human are depicted as dots. Lines are the UBSC statistic values smoothed using loess regression. HSA2 shows the peak of the UBCS values near the ancestral fusion site. Atypical central peak occurs for the UBCS statistic computed using comparisons of the human to all Great Ape genomes. (Bottom panel) Values of parameter (proportion of weak-to-strong in all substitutions) for every 1 Mb window of substitution derived in human chromosome 2

