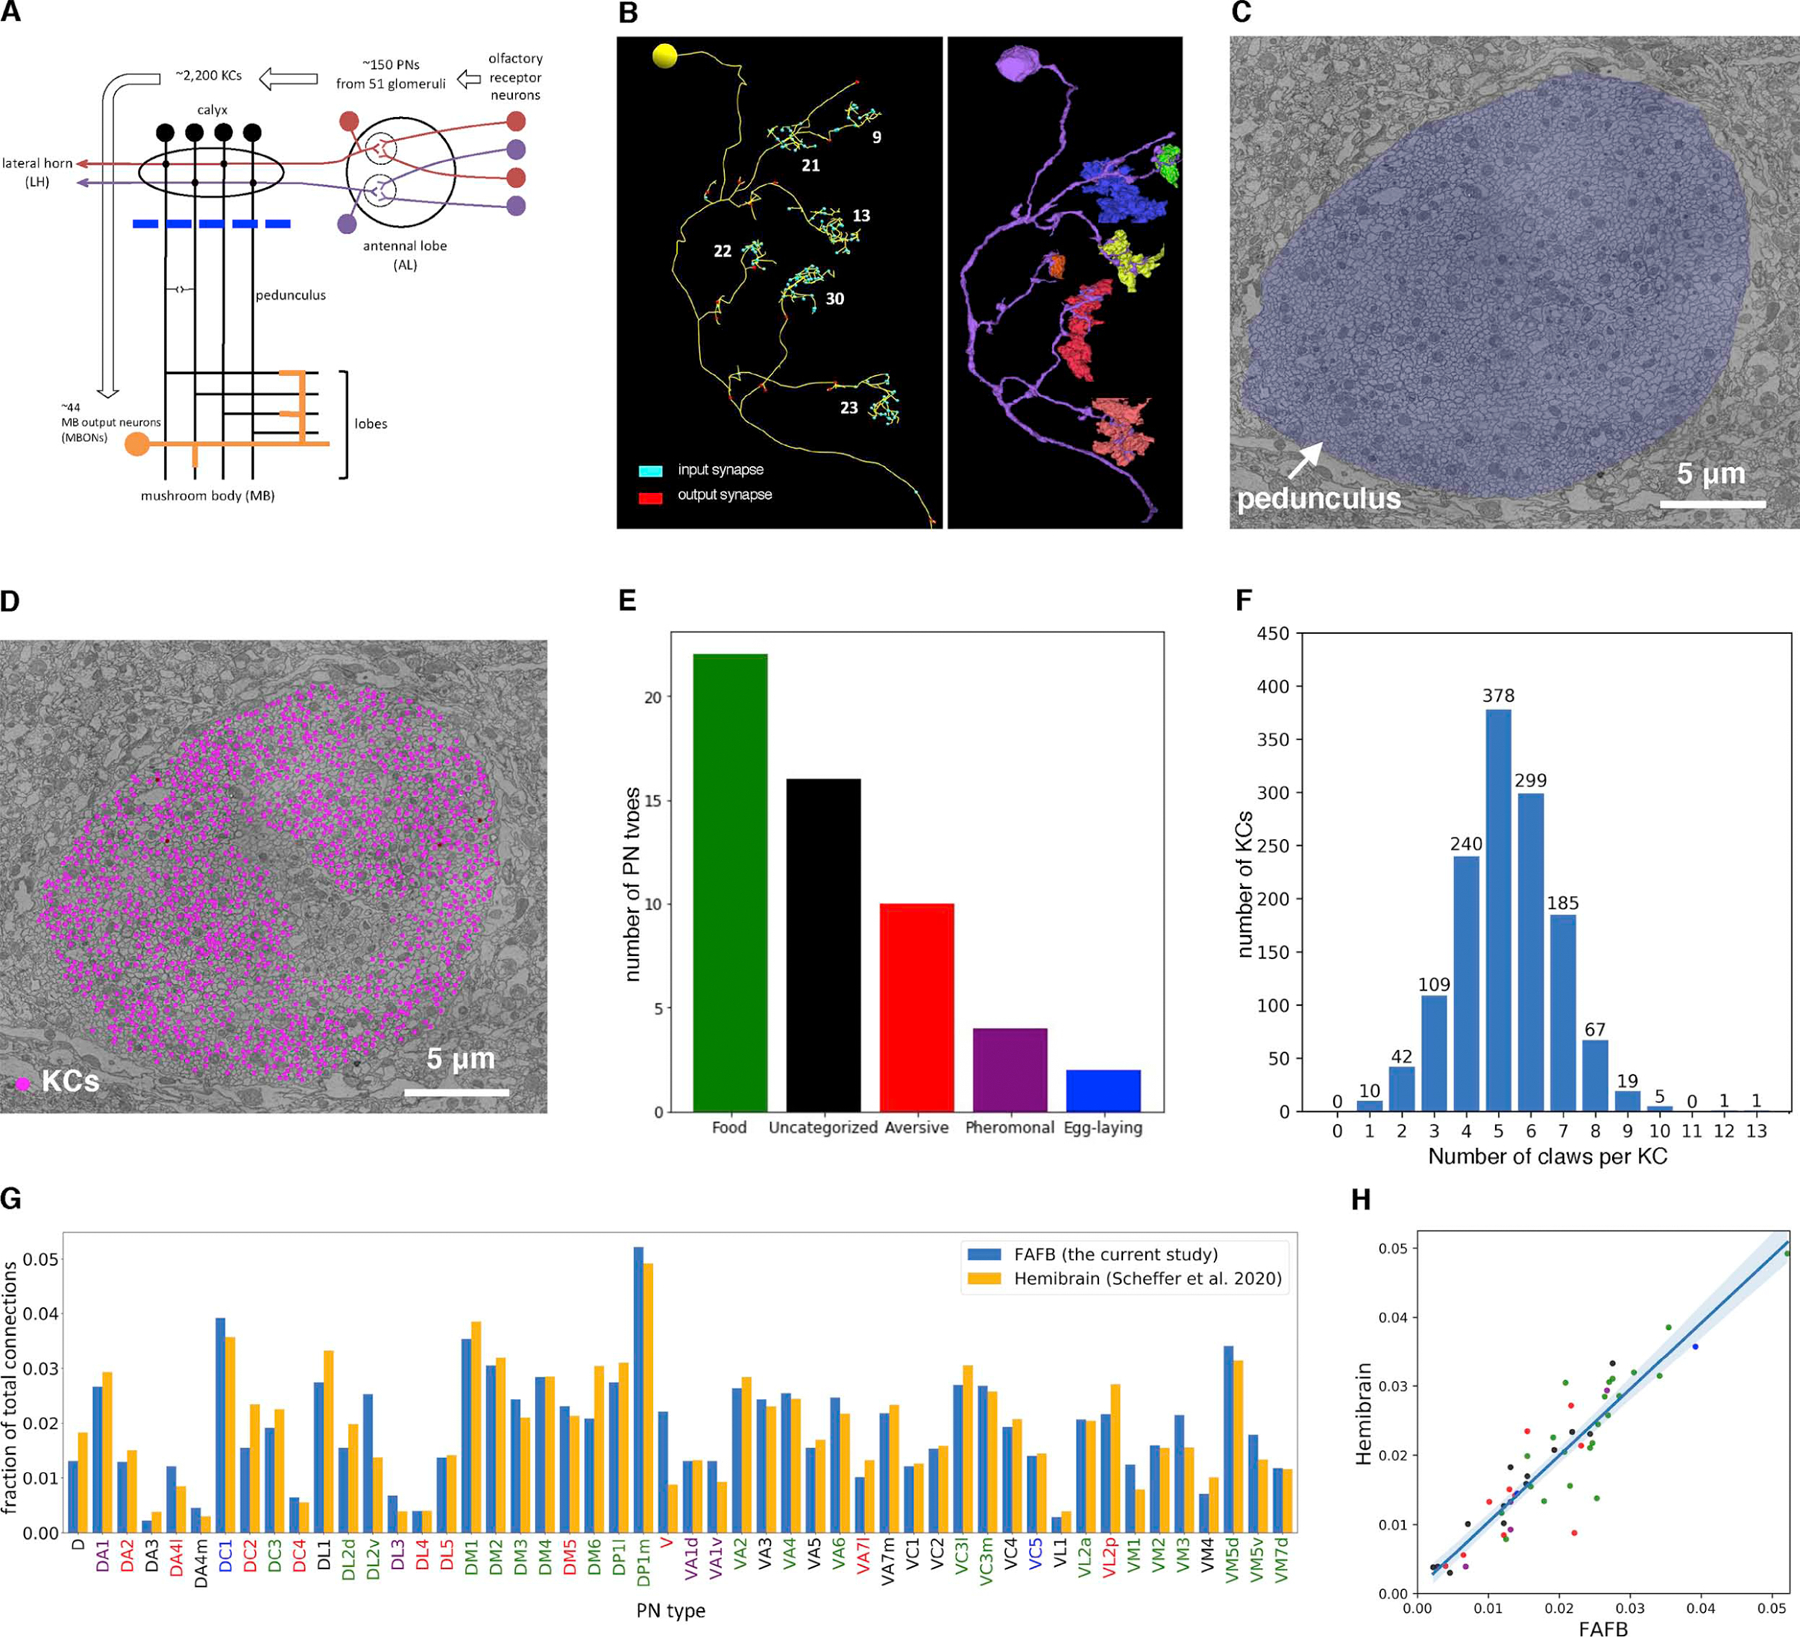
Figure 1. Reconstruction of the PN-to-KC network.

(A) Olfactory pathway schematic. Blue line, the frontal plane where KCs were randomly sampled for reconstruction (C-D).
(B) A representative EM-reconstructed KC. Each claw receives a variable number of synapses (numbers in white) from a single ensheathed PN bouton. Left, skeletonized reconstructions. Right, volumetric segmentation of the same KC (purple) and ensheathed PN boutons (various colors).
(C) Subarea of a frontal section from the whole-brain EM volume, showing the cross-section through pedunculus (blue false color) used for random sampling (D).
(D) Randomly sampled KCs (magenta dots) in the pedunculus. A discrete region in the middle is devoid of magenta points, as it is occupied by other cell classes such as APL and non-olfactory KCs from accessory calyces (i.e. KC-α/βp and KC-γd9).
(E) Number of PN types for each category of behavioral significance based on a literature review (Table S1).
(F) Distribution of number of claws per KC for all randomly sampled KCs (mean ± s.d., 5.2 ± 1.6).
(G-H) The number of PN-KC connections per PN type is consistent between the current study and the ‘hemibrain’ dataset.10 (G), Three or more synapses between each PN-KC pair is counted as a connection. The fraction of connections made by each PN type out of the total number of connections in each dataset is shown. (H), the fraction of output per PN type is highly correlated across the two datasets (r2=0.83; blue shade, 95% confidence interval). Bar labels (G) and points (H) are colored according to behavioral category (E).
See also Table S1.
