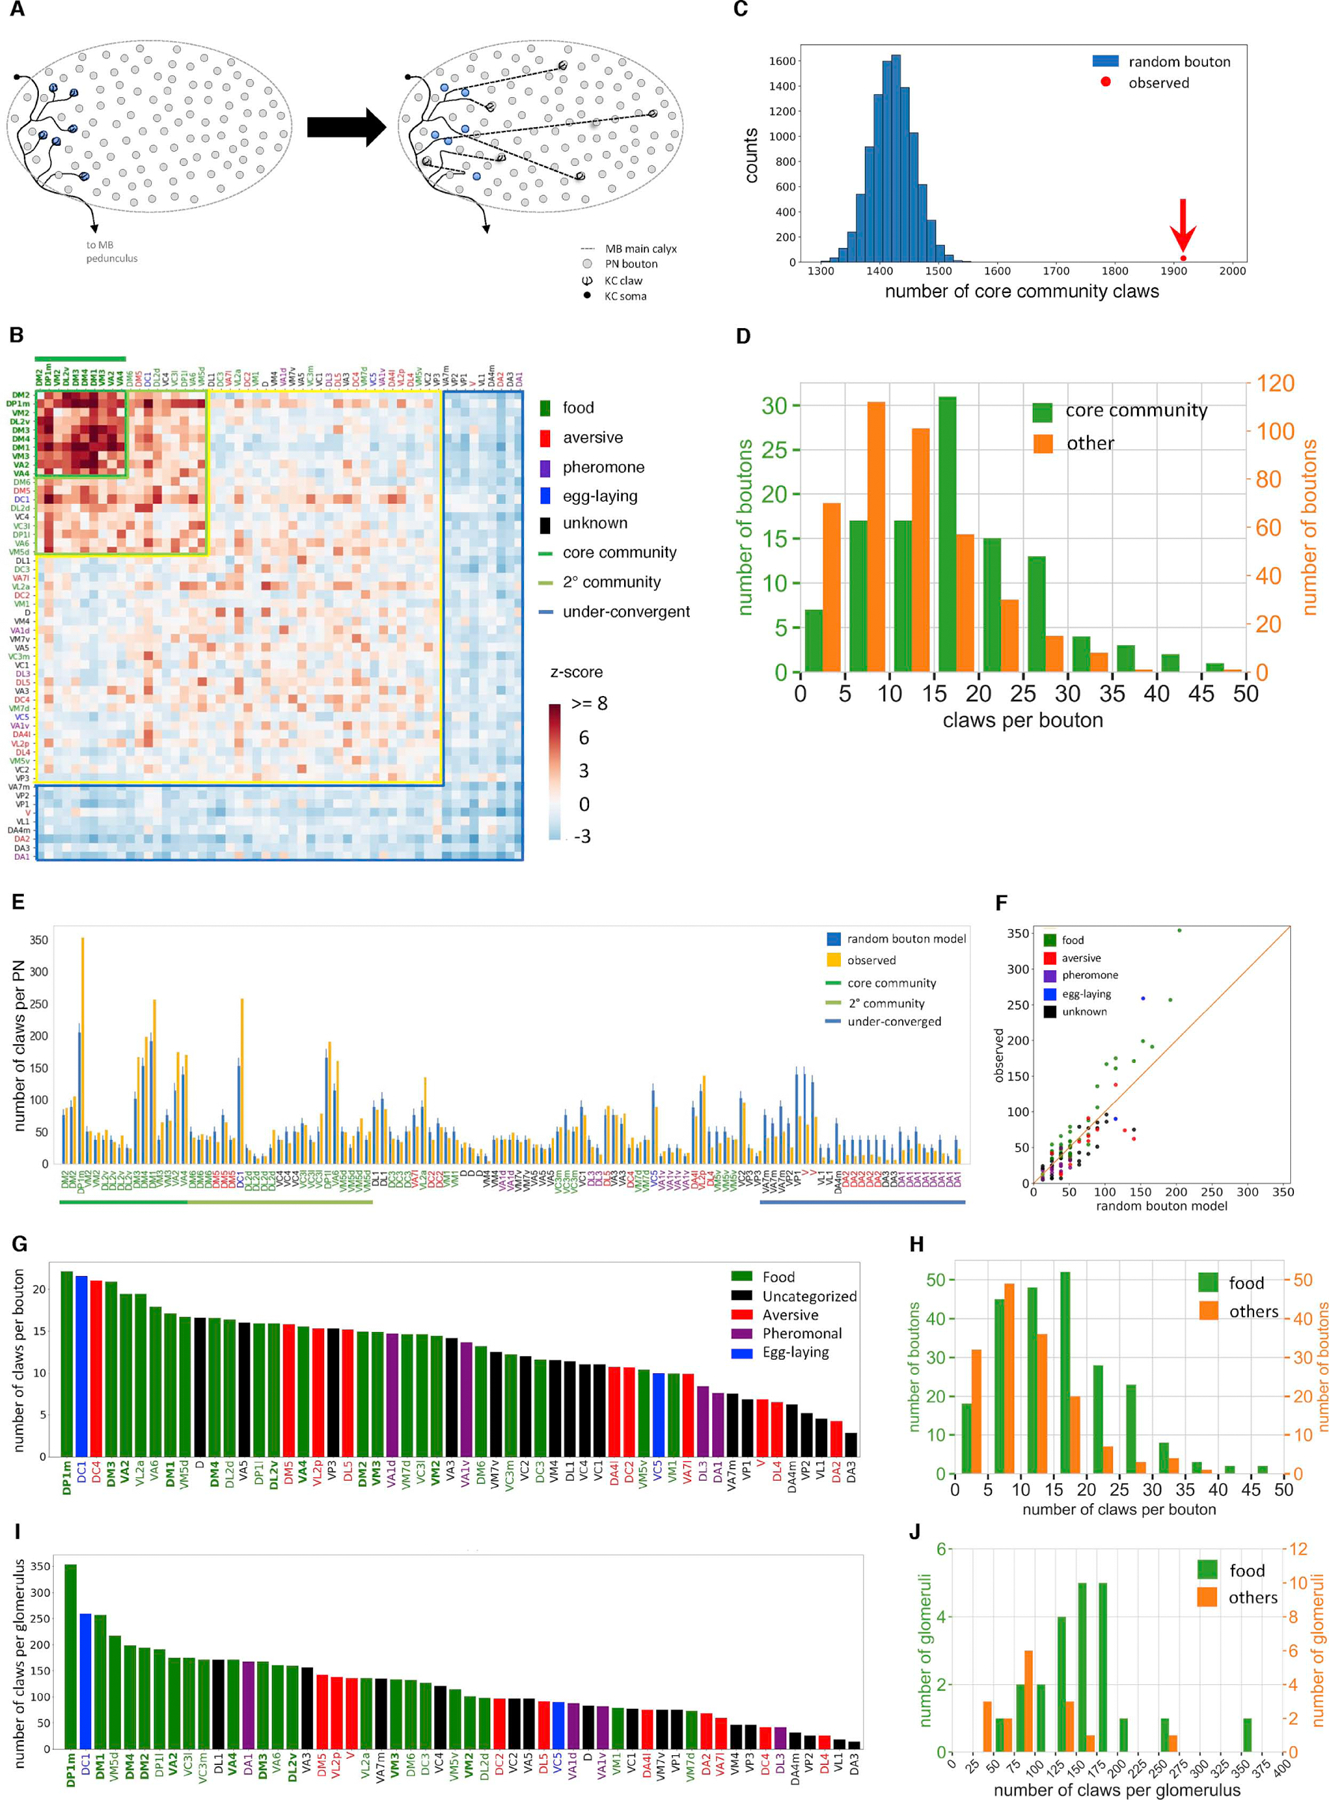
Figure 3. Non-random sampling of olfactory PN input by KCs.

(A) Random bouton null model schematic. Each claw is reassigned to a bouton chosen randomly from all boutons in the MB calyx. This null model ignores the fact that KC dendrites and PN arbors have restricted territories within the calyx, but ensures that the number of claws assigned to a given PN type is proportional to the number of boutons.
(B) Observed PN-to-KC connectivity compared to the random bouton model. Conditional input analysis was applied to 1,356 randomly sampled KCs. A group of PN types (‘community’ PNs, dark and light green lines) provide above-chance levels of convergent input to downstream KCs. All PN types in the core community (dark green with overline), and most in the secondary community (light green), have been reported to primarily respond to food-related odorants (Table S1). In this and subsequent z-score matrices, PN types are color-coded according to behavioral category as in Figure 1E, and core community PN types are decorated with overlines.
(C) Kenyon cells over-sample inputs from core community PN types. The observed number of claws receiving input from core community PNs (1,916; red dot) greatly exceeds the random bouton null model prediction (blue histogram; 10,000 random networks, mean ± s.d., 1,421.7 ± 35.7; z-score, 13.8).
(D) Core community PNs have more claws per bouton than other PNs (mean ± s.d., 17.4 ± 9.3 vs. 11.5 ± 7.4; K-S test p<1×10⁻⁹).
(E-F) Core community PNs in the observed network are presynaptic to more KC claws than predicted by the random bouton model (error bars, s.d. of 10,000 random networks; Chi-square test p<1×10⁻¹⁰). Each bar in (E) and dot in (F) represents a PN. Bar labels (E) and points (H) are colored according to behavioral category (Figure 1E).
(G, I) Number of claws per bouton (G) and number of claws (I) per PN type, in descending order.
(H, J) Food-responsive PNs provided output to more claws than non-food PNs on both a per-bouton (H, mean ± s.d., 15.66 ± 3.08 vs. 10.53 ± 7.3, K-S test p<1.3×10⁻⁹) and per-glomerulus (J, mean ± s.d., 162.95 ± 60.74 vs. 100.06 ± 56.17, K-S test p<2.5×10⁻⁵) basis.
