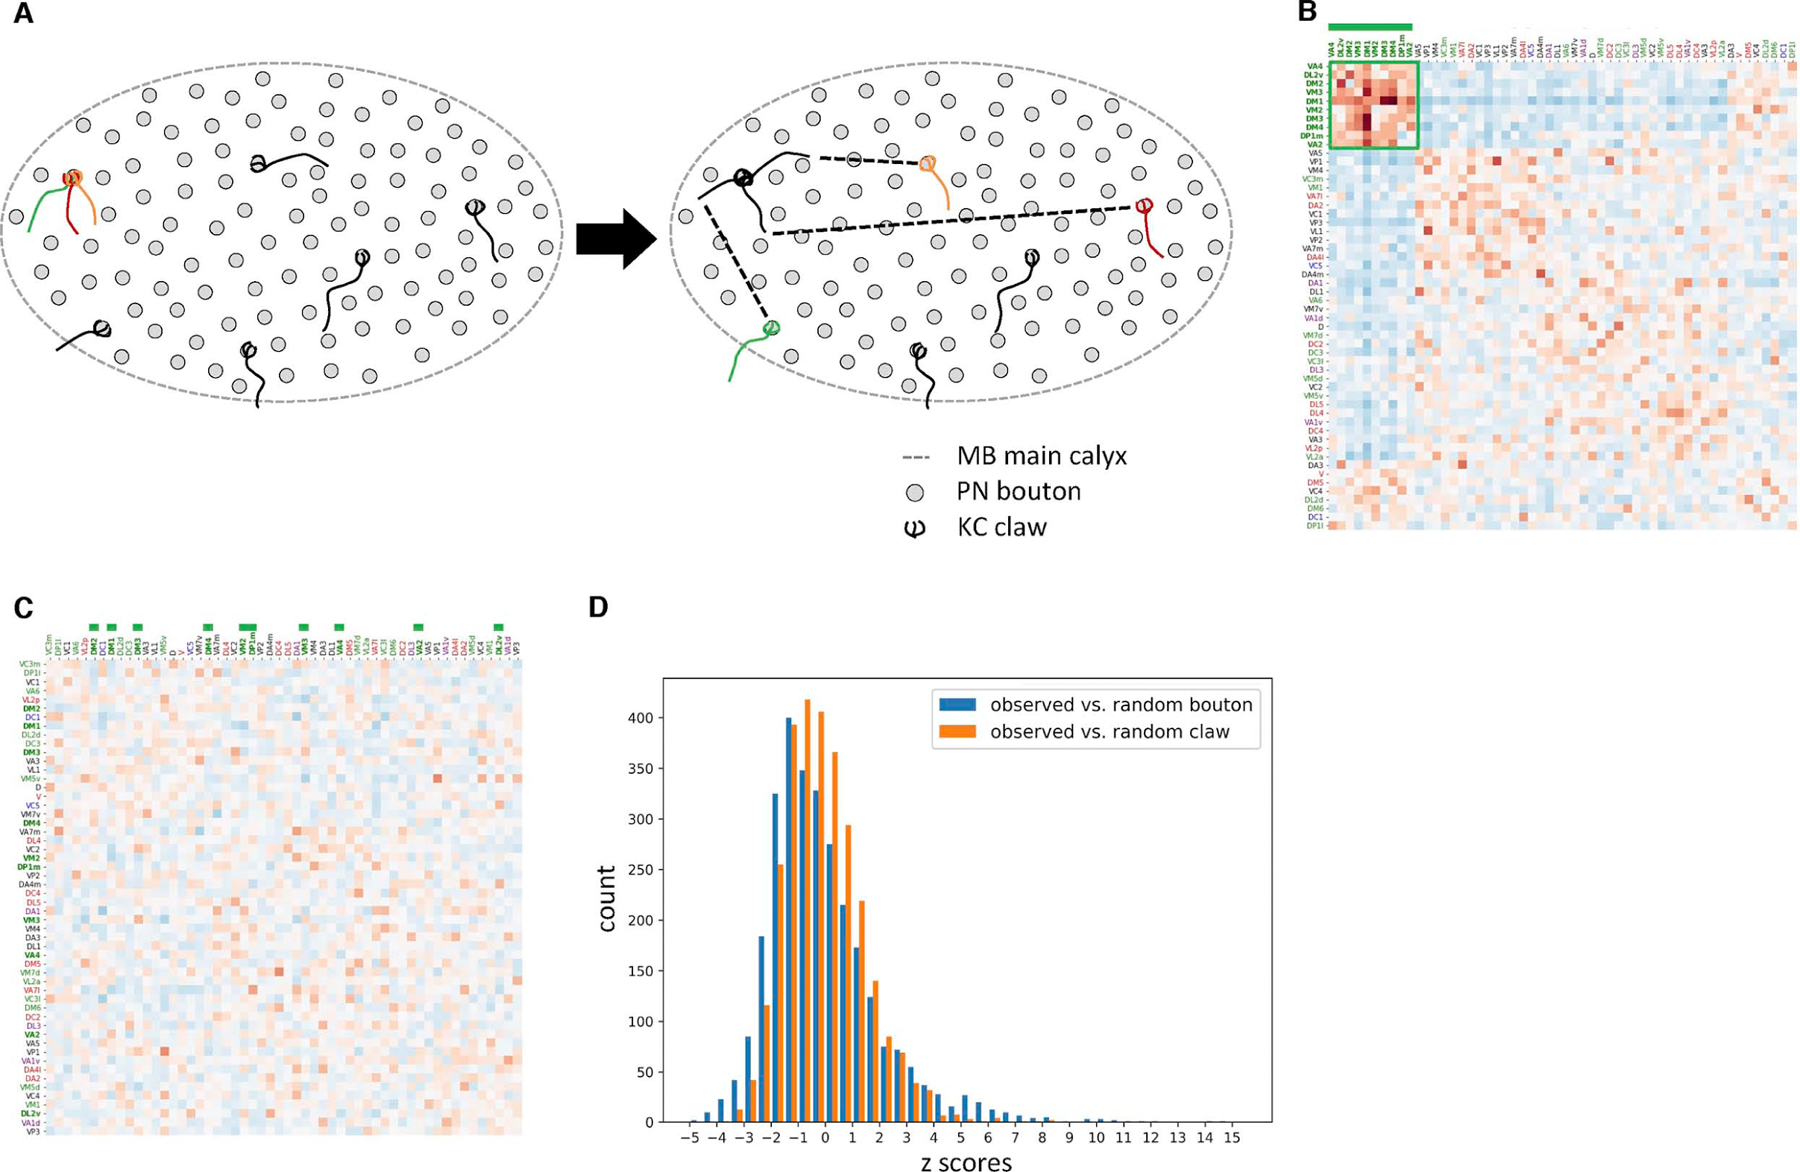
Figure 4. Preferential ensheathment of food-responsive PN boutons by KC claws.

(A) Random claw null model schematic. The biased ensheathment of PN boutons by KCs according to PN subtype is maintained in this null model, while territoriality in the distribution of boutons and claws within the MB calyx is ignored.
(B) Core community PNs types converge more frequently than predicted by the random claw model, suggesting that the preferential ensheathment of their boutons is insufficient to explain the observed network structure.
(C) Conditional input analysis of a single representative network generated using the random claw model shows no clustered structure.
(D) Z-scores for the random claw model (Figure 4B) vary less than for the random bouton model (Figure 3B; mean ± s.d., −0.044 ± 2.11 vs. −0.058 ± 1.47; K-S test p<1×10⁻¹⁰), indicating random claw model captures more of the observed network structure.
See also Figure S5.
