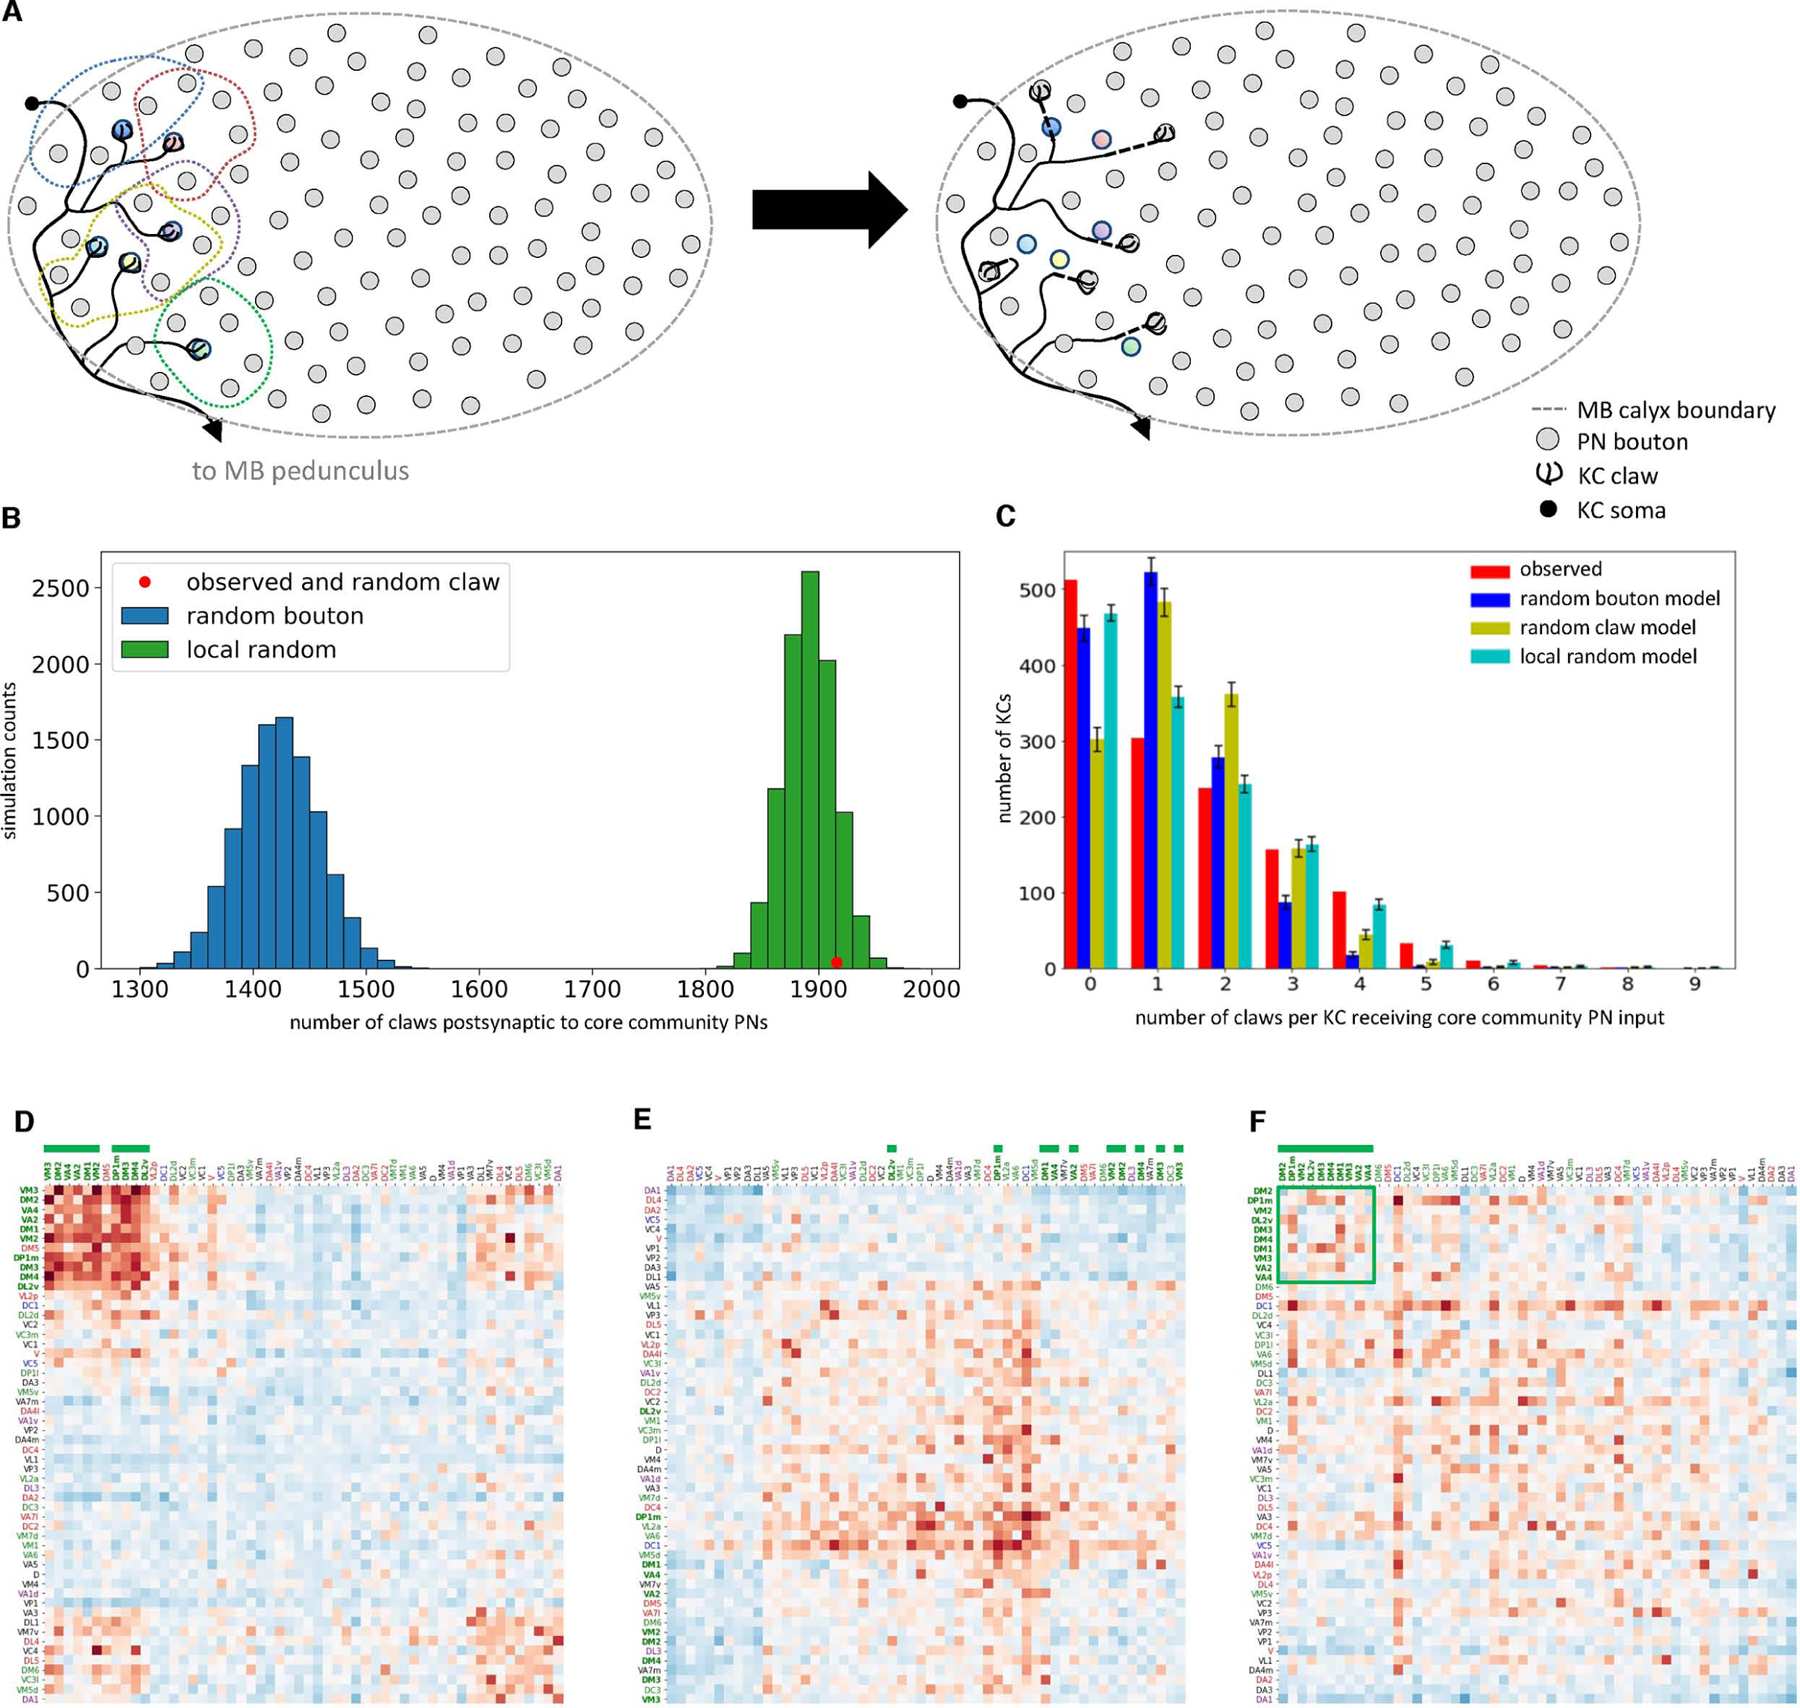
Figure 5. Neurogeometry of PN and KC arbors best explains the observed network structure.

(A) Local random null model schematic. Left: each dashed line circumscribes a claw and its five nearest PN boutons. Right: after randomization, each claw is randomly assigned to one of the five nearest boutons.
(B) The local random model recapitulates the greater number of claws ensheathing core community PN boutons. The observed number of claws receiving inputs from core community PNs (red dot; 1,916 claws) was nearly identical to the mean of the local random model (mean ± s.d., 1,890.6 ± 22.5). By definition, all networks created using the random claw model also have 1,916 claws.
(C) The local random model best recapitulates the number of claws per KC postsynaptic to core community PNs. Observed vs. random bouton, Chi-square test p<1×10⁻¹⁰; observed vs. random claw, Chi-square test p<1×10⁻¹⁰; observed vs. local random, Chi-square test p<0.028 (error bars, ± s.d.).
(D) A single, representative network generated using the local random model recapitulates much of the core community of overconvergent PN types when compared to the random bouton null model.
(E-F) Core community PN types do not converge more often than predicted by the local random model, indicating this more geometrically realistic null model captures much of the observed network structure. (F), Z-scores for the core community PNs (green square) are not elevated compared to other PN types (columns and rows ordered as in Figure 3B).
