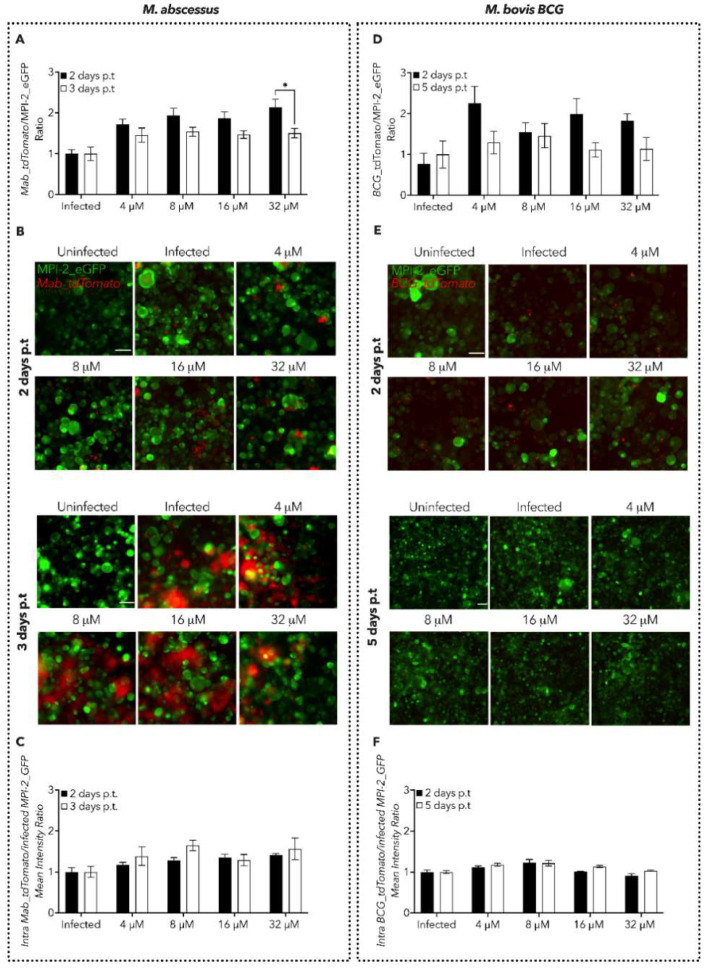
Figure 3.
Characterization of 1f antimycobacterial activity in mAM cells. (A,D) Spectrofluorometer (plate reader) measure of Mab and M. bovis BCG dissemination expressed as a ratio of either Mab_tdTomato (A) or M. bovis BCG_tdTomato (D) fluorescence over MPI-2_eGFP one. The measured time points are indicated in the legend. Black lines indicate the mean ± SEM. Significance by two-way ANOVA followed by Tukey’s multiple comparison test: * p = 0.0327. Data are from five independent experiments. (B,E) Representative images of mAMs infected with either Mab_tdTomato (B) or M. bovis BCG_tdTomato (E). eGFP and tdTomato fluorescence are merged. Scale bar: 50 µm. (C,F) Measure of Mab and M. bovis BCG intracellular dissemination at the single-cell level, expressed as a ratio obtained by dividing intracellular Mab_tdTomato (A) and M. bovis BCG_tdTomato (D) fluorescence over infected MPI-2_eGFP fluorescence. The measured time points are indicated in the legend. Black lines indicate the mean ± SEM. Data are from five independent experiments.

