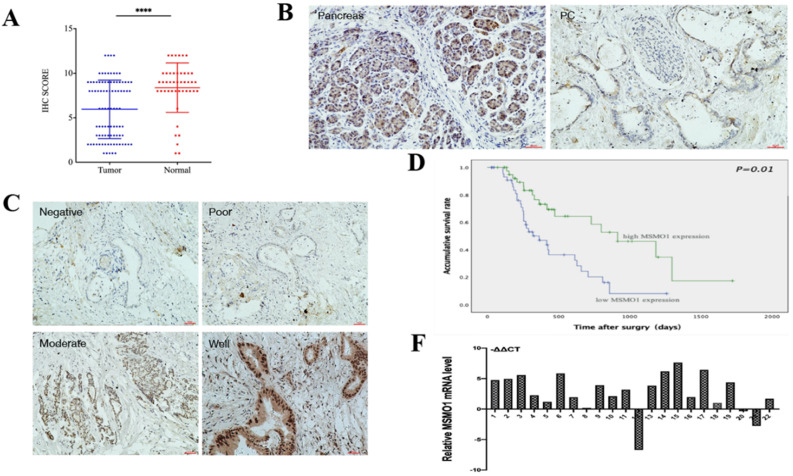
Figure 1.
The MSMO1 expression in PC tissues. (A) Immunohistochemistry was used to calculate the expression of MSMO1 in the cancer tissues and normal tissues. (B) MSMO1 expression in PC tissues and normal pancreatic tissues using IHC. (C) MSMO1 expression intensity in different Differentiation levels of PC tissues. (D) Kaplan-Meier survival curves in PC patients with different MSMO1 expression. (F) MSMO1 mRNA expression quantities in 22 pairs tissue samples via qRT-PCR. ****P < 0.0001 compared with the control.

