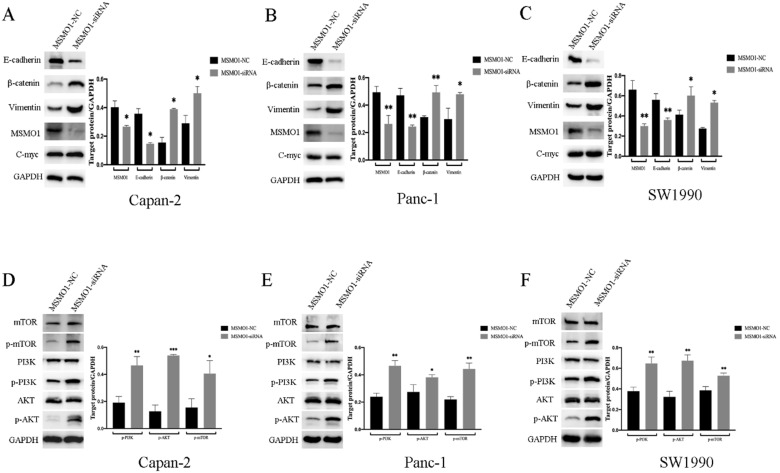
Figure 3.
Discrepancy of EMT-induced targets and PI3K-AKT-mTOR signal pathway in vitro. (A) The protein level of MSMO1 and EMT features in Capna-2 cells. (B) The protein level of MSMO1 and EMT features in Panc-1 cells. (C) The protein level of MSMO1 and EMT features in SW1990 cells. (D) The changes of PI3K-AKT-mTOR signal pathway in Capan-2 cells. (E) The changes of PI3K-AKT-mTOR signal pathway in Panc-1 cells. (F) The changes of PI3K-AKT-mTOR signal pathway in SW1990 cells. Bars indicate means ± SD, *P < 0.05, **P < 0.01, ***P < 0.001.

