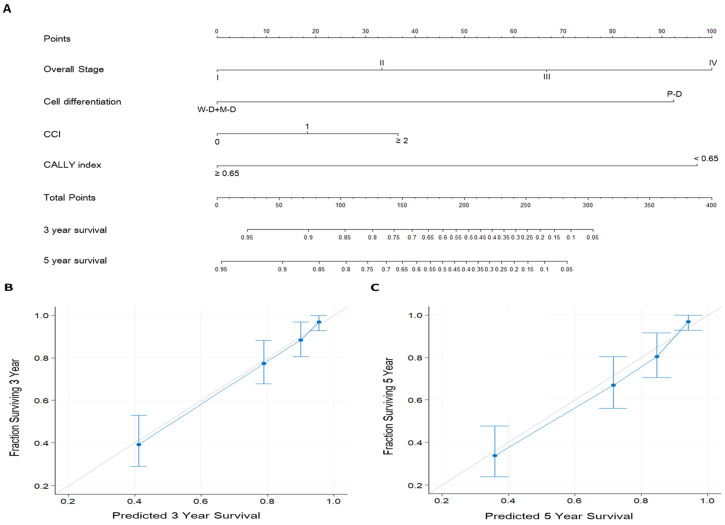
Figure 5.
Prognostic nomogram established for prediction of 3-year and 5-year OS. A. Nomogram incorporating the CALLY index and clinicopathological factors. Each factor is connected to the uppermost point score by a vertical line, and the corresponding points represent how much this factor added to the risk. A total points score is obtained by summing the points from each factor and converted into 3-year and 5-year OS probabilities by drawing vertical lines to the respective axis below. B. Calibration plots of 3-year OS. C. Calibration plots of 5-year OS. Calibration plots indicate the consistency between nomogram-predicted survival and actual outcomes. Perfect survival prediction is indicated by the 45° light-gray line. The nomogram performance and 95% CIs for survival are indicated blue dots and bars, respectively.

