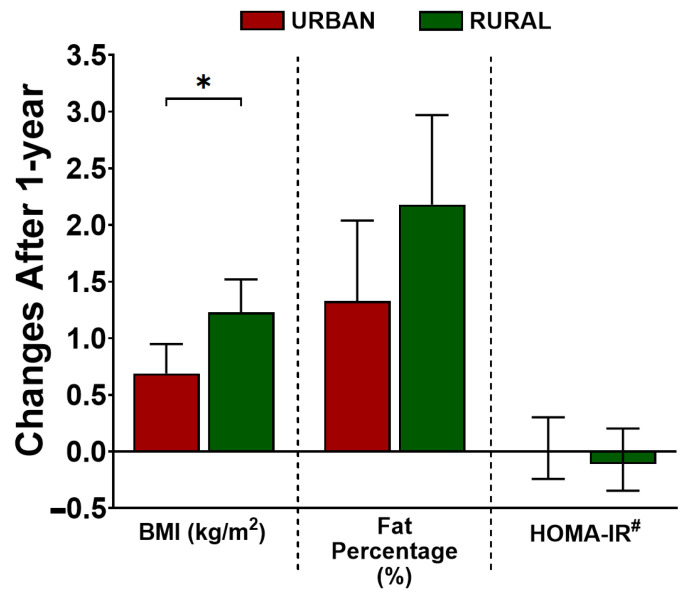
Figure 1.
Changes of BMI, fat percentage, and whole-body insulin resistance (HOMA-IR) in urban and rural subjects after 1-year of living in an urban environment. The changes are presented as estimate and 95% confidence interval (95%CI). The changes in each group and the differences of changes between the urban and rural group for each parameter were analyzed using a linear-mixed model, adjusted for age and sex. The p-value depicted in the figure represents the p-value for interaction (Pint), the level of significance in the differences of changes between the two groups. * p < 0.05. # HOMA-IR was log-transformed (base 2) for analysis. The estimates (95%CI) were back-transformed (2β) and presented as a multiplicative scale compared to baseline. BMI: body mass index; HOMA-IR: homeostatic model assessment for insulin resistance.

