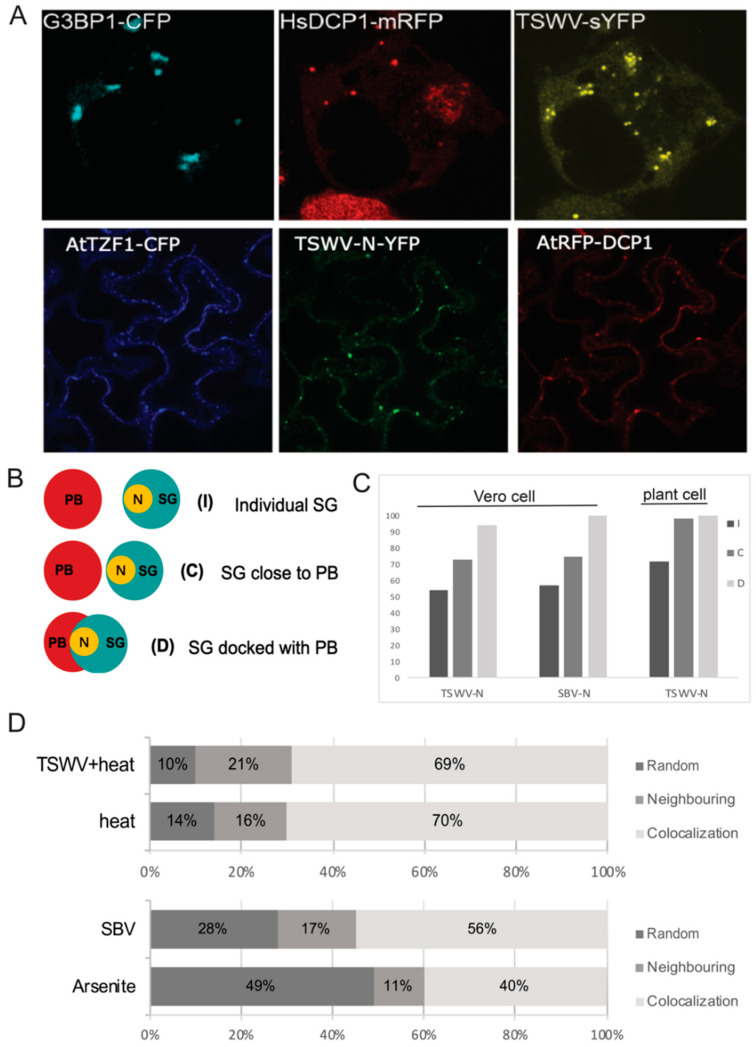
Figure 3.
Localization and quantification of N proteins relative to individual PB and SG marker proteins, and PB-SG docking stages. (A) Images of TSWV N protein expression in Vero cells, subjected to arsenite treatment for SG-induction, showing the spatial distribution of N protein relative to PB and SG markers (Upper panel). Images of TSWV N protein expression in N. benthamiana cells, subjected to a heat shock for SG-induction, showing the spatial distribution of N protein relative to PB and SG markers (lower panel). (B) Graphical description of different patterns of N protein associated with SG in different connections to PB (Left panel). The indication “I” represents individual SG distant from PB, “C” represents SG close to PB. “D” represents SG docked on PB. (C) Quantification of transiently expressed TSWV and SBV N protein associated with different types of SG, as defined in panel B, in Vero cells, and of TSWV N protein in plant cells. (D) Quantification of PB and SG association types in plant cells after TSWV infection + heat shock and after heat shock only (upper half of the panel) and quantification of PB and SG association types in animal cells after SBV infection and after arsenite treatment (lower half of the panel).

