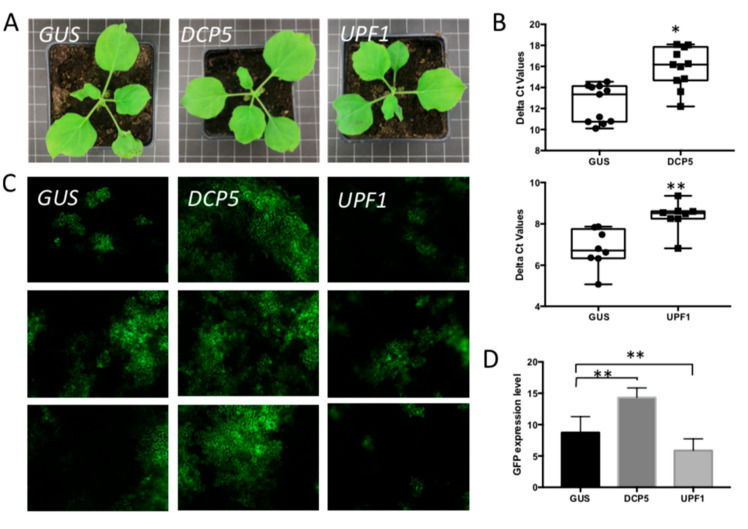
Figure 4.
The effect of silencing P body elements on TSWV replication. (A) Plant phenotype after VIGS-silencing DCP5 and UPF1, compared with GUS-silenced control plant. (B) qRT-PCR assay to quantify the silencing efficiency. Non-parametric t test was performed. * p-value < 0.05, ** p-value < 0.01. (C) Green fluorescence resulting from eGFP expression from a TSWV replicon in plants silenced on P body elements, and control plants. Plants were infiltrated TSWV-eGFP replicon constructs 2.5-week post silencing and harvested at around 60 hpi. (D) Statistical analysis of GFP intensity in the silenced plants and control plants. A non-parametric t test was performed. * p-value < 0.05, ** p-value < 0.01.

