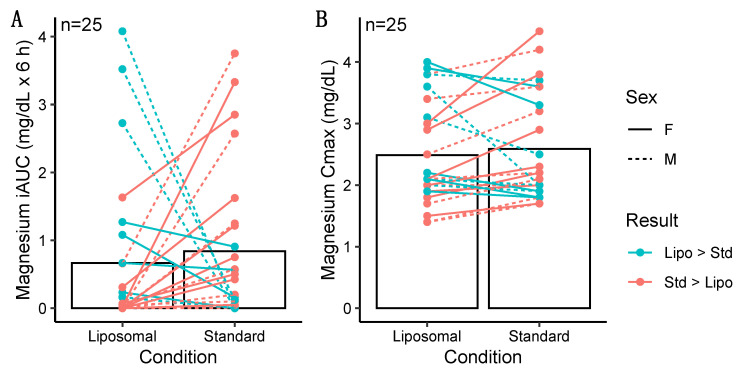
Figure 5.
Individual differences in incremental area under the curve (iAUC; panel A) and maximal observed concentration (Cmax; panel B) values for magnesium. Magnesium iAUC values (p = 0.30 via Wilcoxon signed-rank test) and Cmax values (p = 0.41 via paired samples t-test) did not differ between conditions. Individual responses are represented by lines, and bars represent mean values in each condition.

