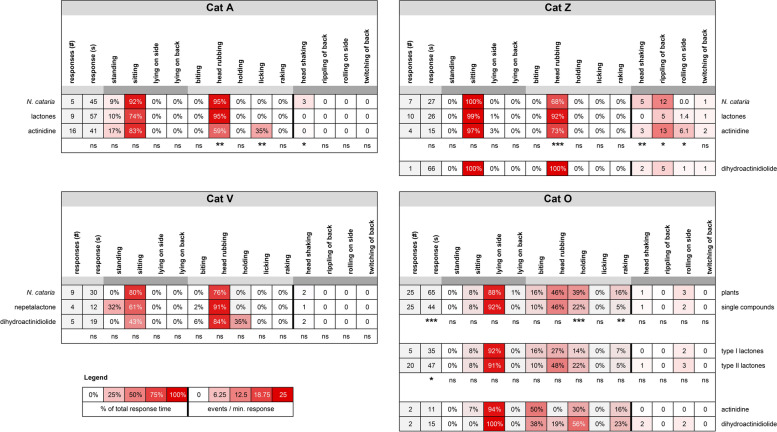
Fig. 18.
Heatmaps showing similarities and differences in body position and behaviors of 4 cats in response to cat-attracting plants and single compounds. Not all cats responded to all classes of single compounds and therefore comparisons differ between cats. Responses to actinidine and dihydroactinidiolide of cat O and to dihydroactinidiolide of cat Z are shown but were not included in the statistical analysis because the number of responses was two or less. Unless otherwise indicated, numbers represent the median. The Kruskal-Wallis test followed by Dunn’s post hoc test or the Mann-Whitney test was done to test for statistically significant differences. #, frequency; s, seconds; ns, not statistically significantly different; * P < 0.05, ** P < 0.01, *** P < 0.001

