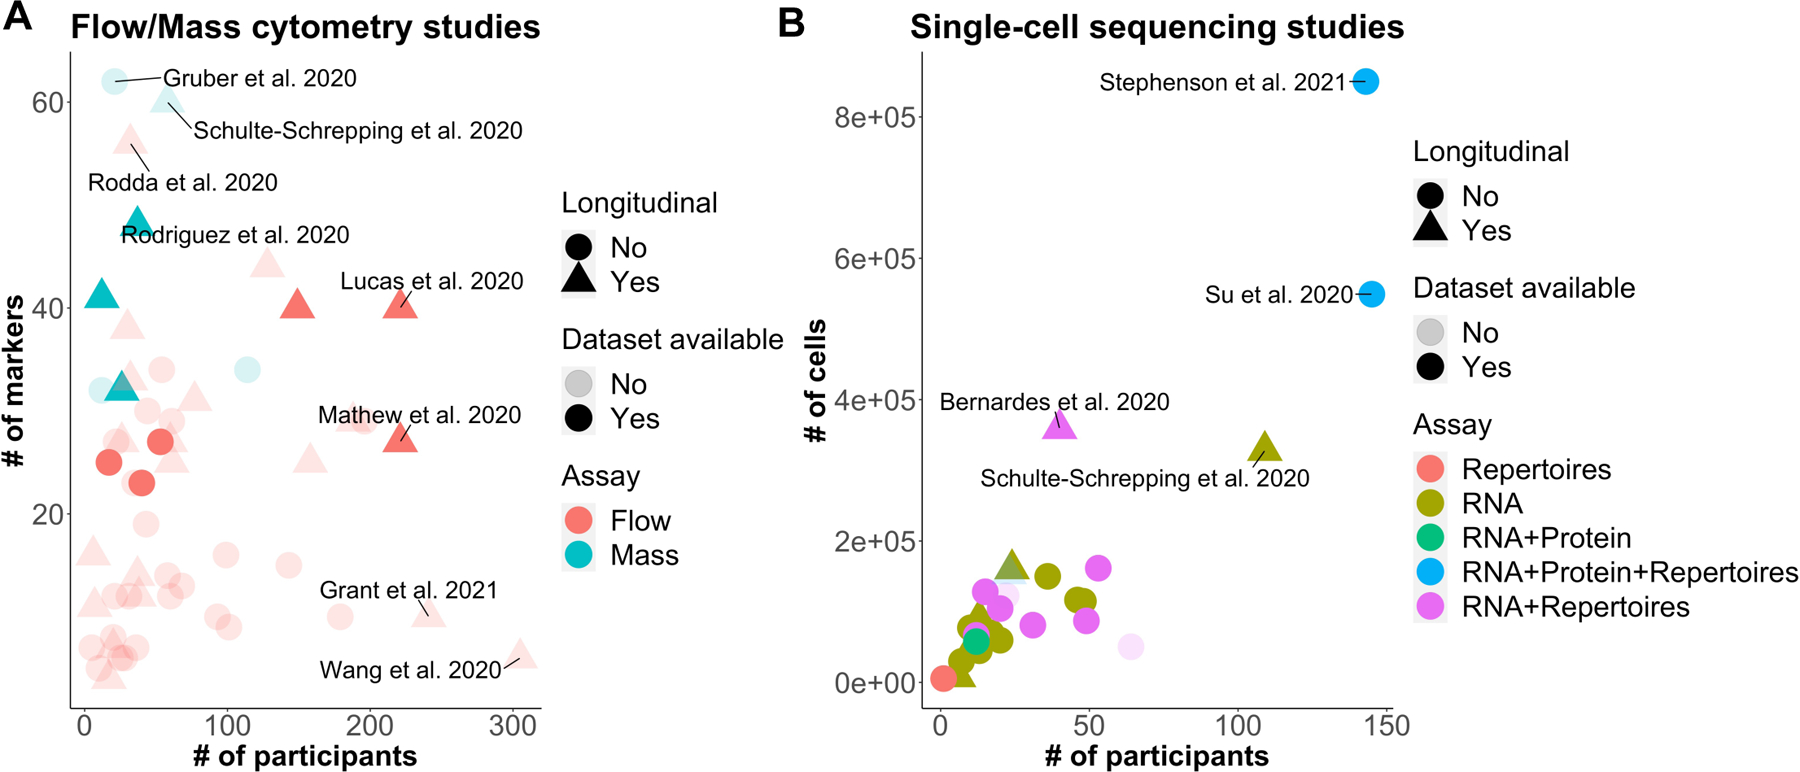
Figure 1.

Visual representation of characteristics of the 64 published articles or publicly posted preprints on COVID-19 that have used one or more single-cell technologies (March 2020 – March 2021). (a,b) Scatter plots showing the number of participants versus (a) the number of flow cytometry markers or (b) the number of cells for which data are available in each study. Each symbol represents a dataset using one of the single-cell technologies from a single article/preprint. Opacity indicates dataset availability to the public (light, no; dark, yes), shape indicates whether the dataset has longitudinal data (circle, no; triangle, yes), and color indicates assay type [(a) red, flow cytometry; cyan, mass cytometry; (b) red, repertoires; gold, RNA; green, RNA plus protein; blue, RNA plus protein plus +repertoires; and magenta, RNA plus repertoires].
