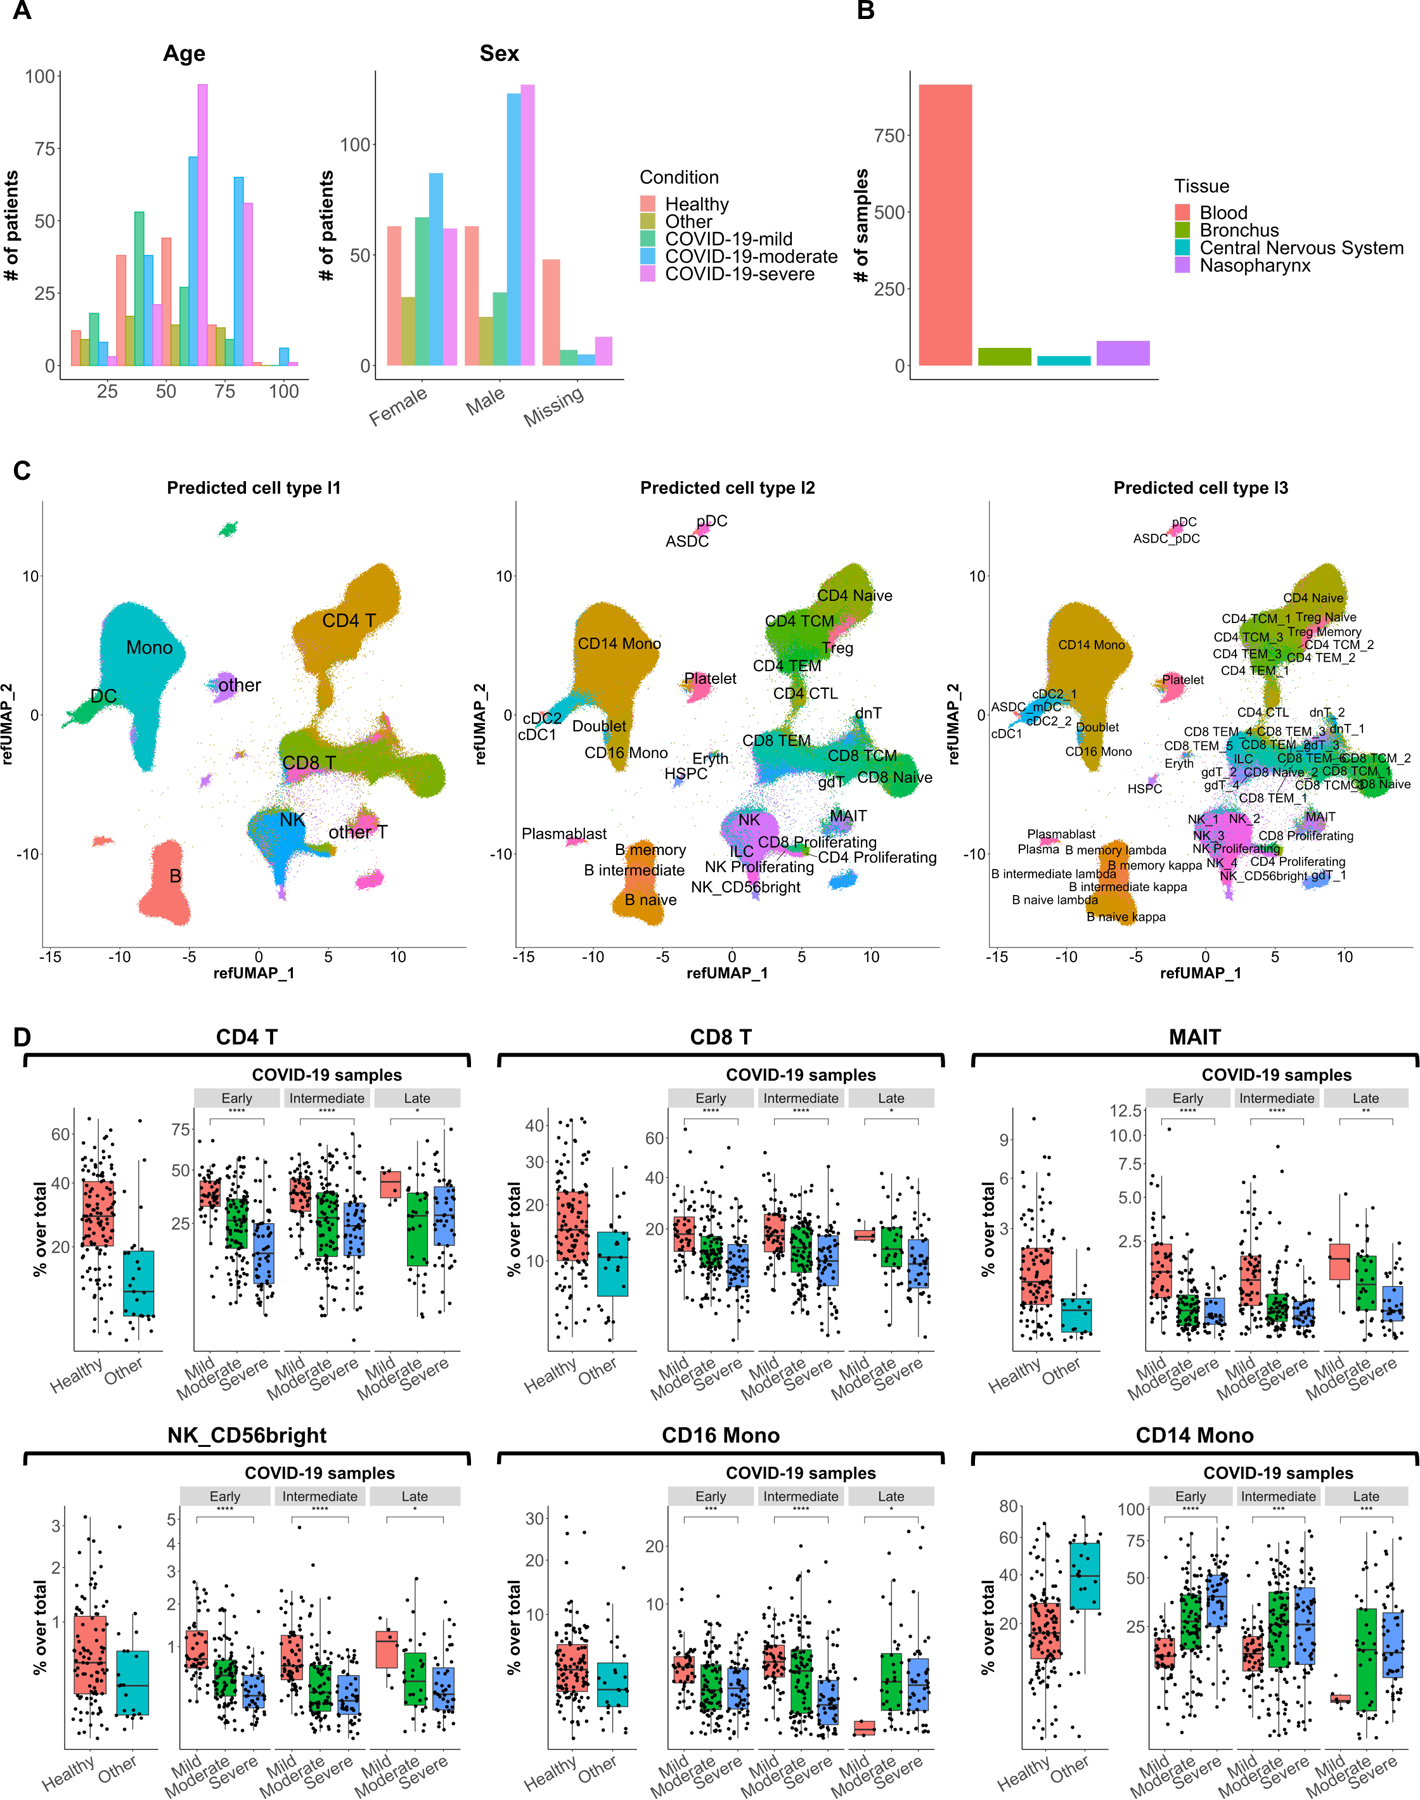
Figure 2.

Visual representation of single-cell transcriptomics data. (a) Plots showing the distribution of age (left panel) and sex (right panel) among individuals included in the collected 21 datasets. (b) Bar plot showing the number of samples per tissue type among the collected 21 datasets. (c) Uniform manifold approximation and projection (UMAP) plots showing the projection of over 2.5 million single cells from 16 PBMC and whole blood datasets (the latter minus neutrophils and basophils) mapped to the Seurat CITE-seq reference, colored and labeled by reference-defined cell type annotations at level 1 (left panel), level 2 (middle panel), and level 3 (right panel) granularity. (D) Box plots showing the frequencies of CD4+ T cells, CD8+ T cells, mucosal-associated invariant T (MAIT) cells, CD56bright NK cells, CD16+ monocytes, and CD14+ monocytes among samples grouped by disease severity and time points for COVID-19 samples. Samples from Arunachalam et al.22 (enriched for DCs), Meckiff et al.98 (enriched for antigen-specific CD4+ T cells), Kusnadi et al.99 (enriched for antigen-specific CD8+ T cells), and Bacher et al.103 (enriched for antigen-specific CD4+ T cells) were excluded. Early, <= 8 days post symptom onset; intermediate, > 8 and <= 15 days post symptom onset; late, > 15 days post symptom onset. Statistical significance between mild and severe was determined by Wilcoxon test. *: p <= 0.05, **: p <= 0.01, ***: p <= 0.001, ****: p <= 0.0001.
