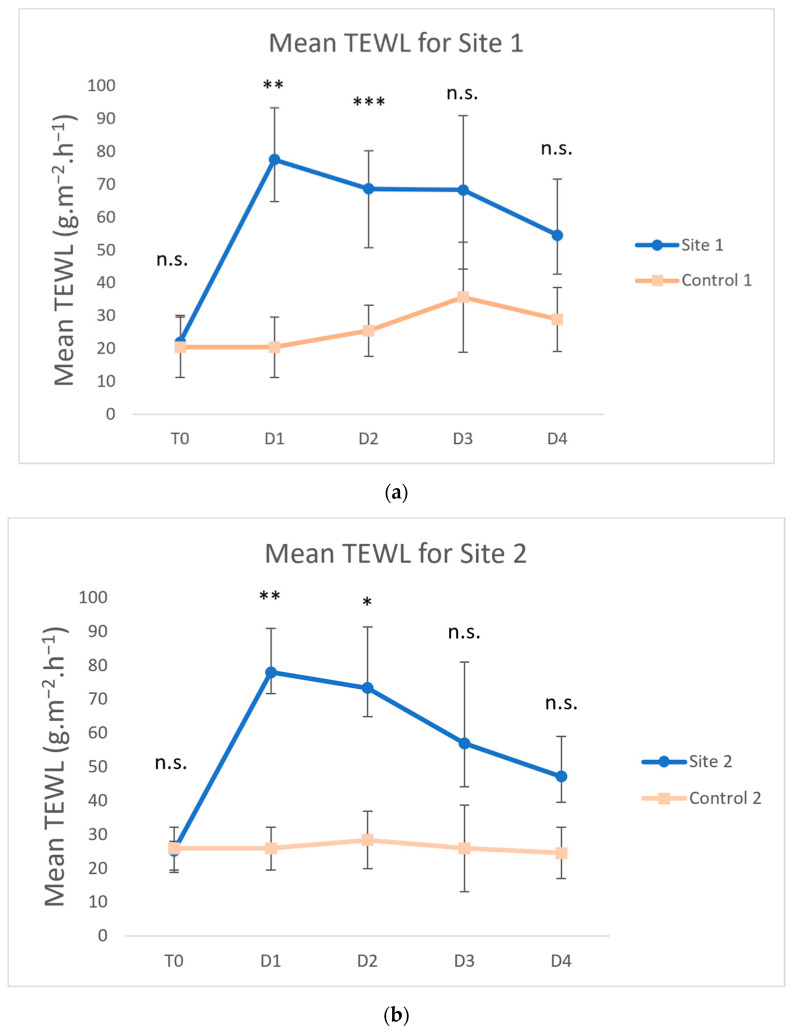
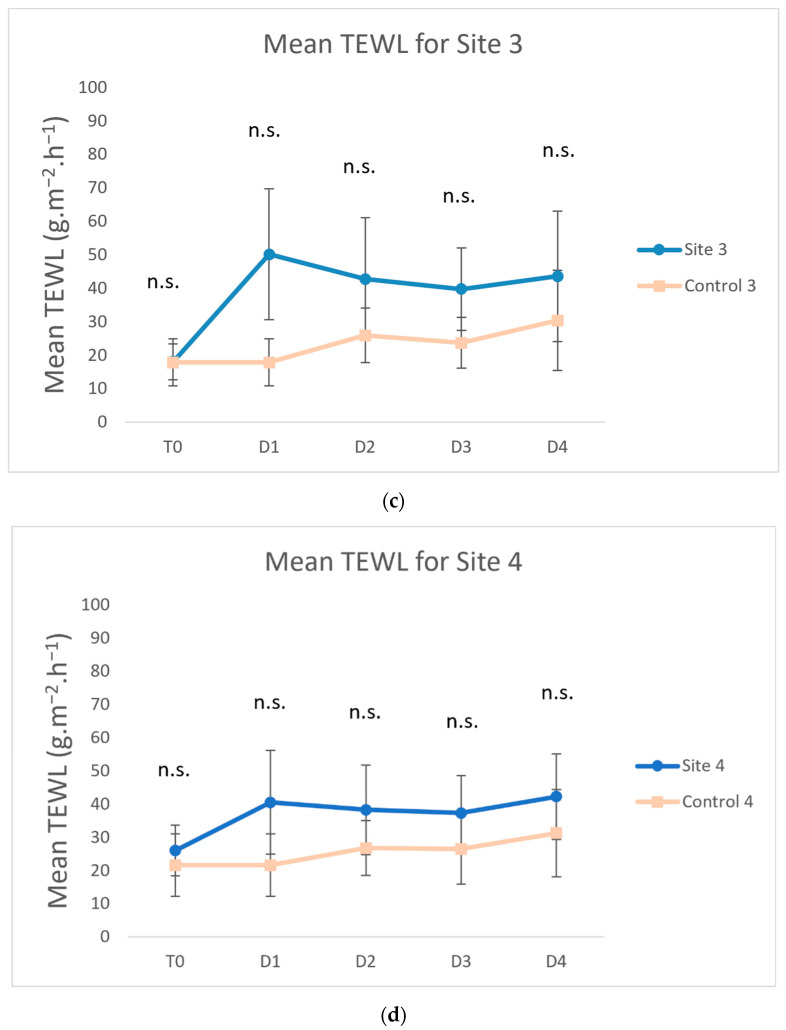
Figure 2.
Means and standard deviations of transepidermal water loss (TEWL) for Site 1 (Week 1) (a), Site 2 (Week 2) (b), Site 3 (Week 3) (c) and Site 4 (Week 4) (d). Days were labeled as T0 (before tape stripping), D1 (one hour after tape stripping), D2 (24 h after tape stripping), D3 (48 h after tape stripping) and D4 (72 h after tape stripping). The values increased for test sites after tape stripping and decreased towards control values on the following days (*** p < 0.001; ** p < 0.01; * p < 0.05; n.s., not significantly different from control).


