. 2021 Aug 13;9(10):1202–1213. doi: 10.1158/2326-6066.CIR-20-0983

Figure 5.

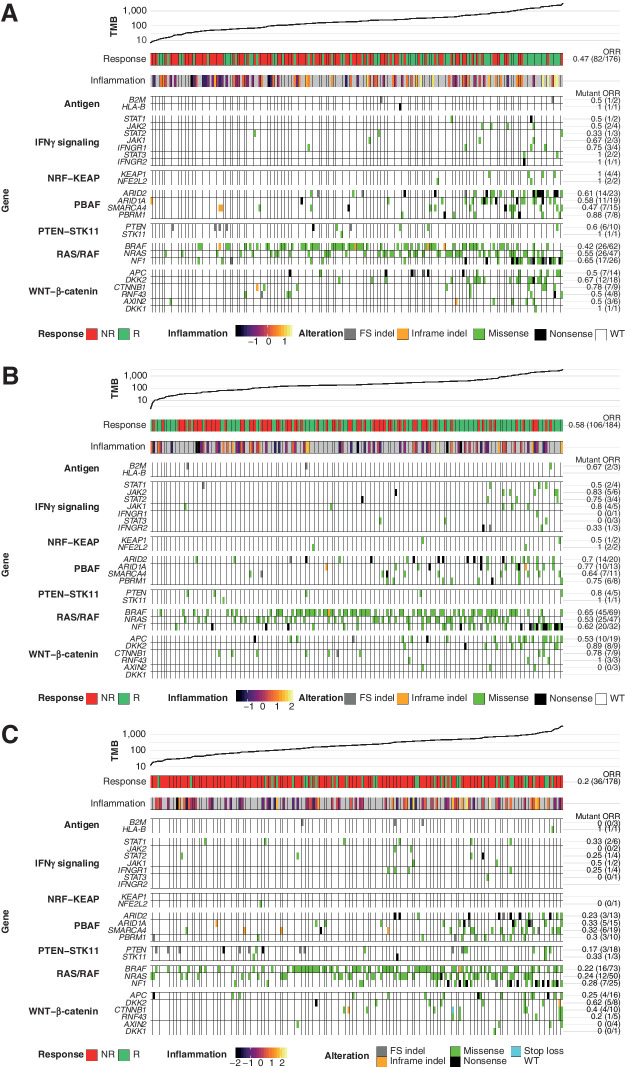
Figure 5. Heatmaps representing the relationship of candidate gene mutations to BOR, TMB, and inflammatory score in CheckMate 067. Patients in each arm are ordered by increasing TMB; inflammatory score is shown for patients with evaluable GEP results. ORR is provided as a fraction of responders over total mutated tumors for each gene assessed. A, Patients in the NIVO arm (n = 176). B, Patients in the NIVO+IPI arm (n = 184). C, Patients in the IPI arm (n = 178). FS, frameshift; NR, nonresponders; R, responders.

Heatmaps representing the relationship of candidate gene mutations to BOR, TMB, and inflammatory score in CheckMate 067. Patients in each arm are ordered by increasing TMB; inflammatory score is shown for patients with evaluable GEP results. ORR is provided as a fraction of responders over total mutated tumors for each gene assessed. A, Patients in the NIVO arm (n = 176). B, Patients in the NIVO+IPI arm (n = 184). C, Patients in the IPI arm (n = 178). FS, frameshift; NR, nonresponders; R, responders.