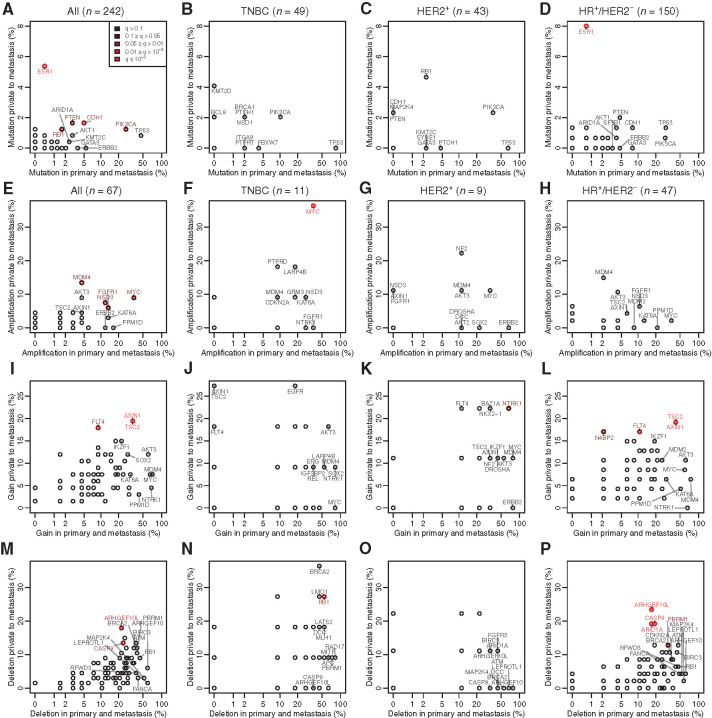
Figure 3.
Comparison of the truncal aberrations with those private to the metastasis. All plots are on paired samples, each point representing the percentage of tumors with an aberration common between the primary tumor and the metastasis versus the percentage of tumors with an aberration found only in the metastasis. Mutations are shown (A, all subtypes; B, TNBC; C, HER2+; D, HR+/HER2−) as well as CN amplifications (normalize CN > 4; E, all subtypes; F, TNBC; G, HER2+; H, HR+/HER2−), gains (normalized CN > 1.5; I, all subtypes; J, TNBC; K, HER2+; L, HR+/HER2−) and deletions (normalized CN < 1.5; M, all subtypes; N, TNBC; O, HER2+; P, HR+/HER2−). The points are colored in function of their q-values, which assess whether a given aberration is more often private to the mutation than expected by the play of chance, corrected for multiple testing by panel.

