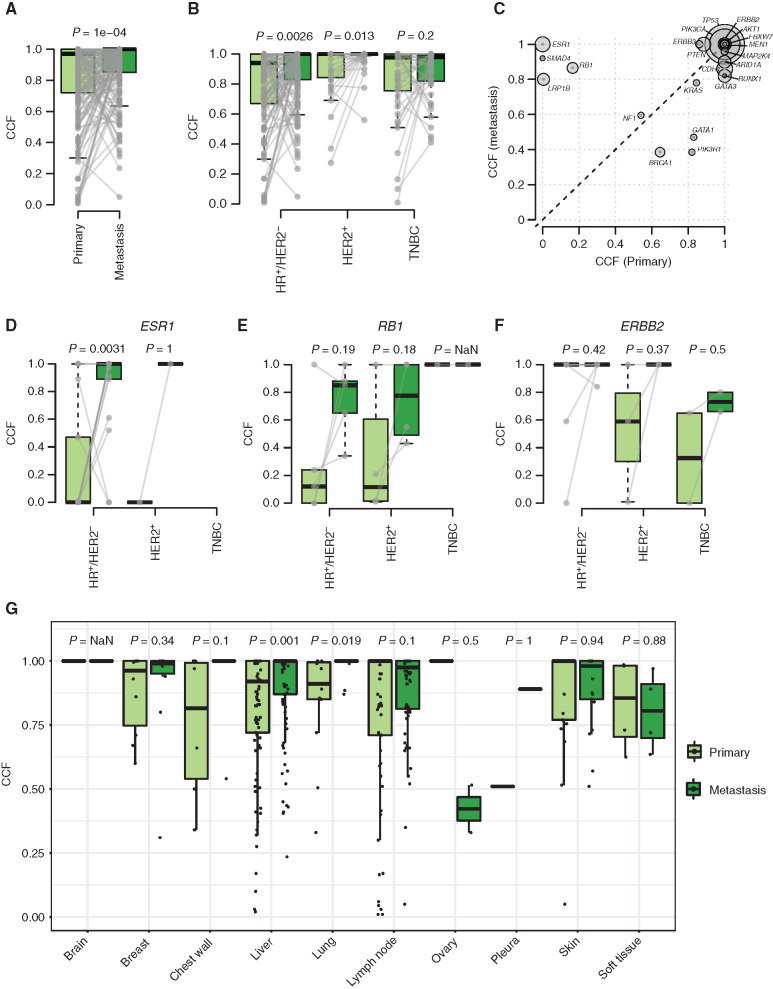
Figure 4.
CCF changes between primary and metastatic samples. Box plots showing the distribution of median CCF by patient in paired primary and metastatic samples (A) and stratified by subtype (HR+/HER2−, HER2+, TNBC; B). Gray lines refer to paired samples. C, Median CCF by driver genes in metastatic (y-axis) versus primary (x-axis) samples. The size of the circles refers to each gene alteration frequency. Box plots of the distribution of CCF for driver mutations in ESR1 (D), RB1 (E), and ERBB2 (F), stratified by subtype. G, Distribution of median CCF in paired primary and metastatic samples by biopsy site. P values are estimated by paired Wilcoxon–Mann–Whitney test.

