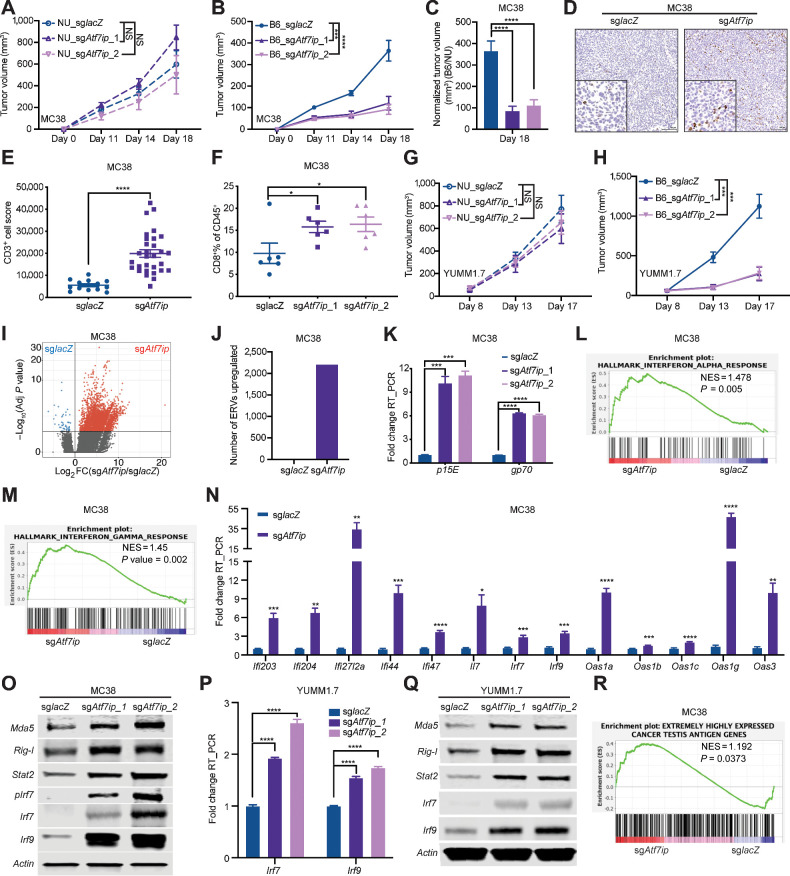
Figure 3.
Atf7ip disruption stimulates antitumor immunity in vivo. A and B, Tumor growth curves of MC38 tumors with or without Atf7ip deficiency in NU/NU mice and B6/J mice (NU/NU: n = 8 mice/group, B6/J: n = 16 mice/group). C, Normalized tumor volume of B6/J mice at day 18. D, CD3 IHC staining of tumor samples at day 19. E, Quantification of CD3+ cells in D. F, Bar graph of CD8+ T-cell percentage in CD45+ cells in the tumor samples at day 19. G and H, Tumor growth curves of YUMM1.7 tumors with or without Atf7ip deficiency in NU/NU mice and B6/J mice (NU/NU: n = 8 mice/group, B6/J: n = 12 mice/group). I, Volcano plot illustrating retroelements that were upregulated (red) in Atf7i-deficient MC38 cells. J, Quantification of the number of ERV-derived antigens in G (adj. P < 0.05, fold change >2). K, RT-PCR of p15E and gp70 that encode tumor-associated ERV-derived antigens. L and M, Enrichment of genes associated with INTERFERON_ALPHA_RESPONSE (L) and INTERFERON_GAMMA_RESPONSE (M). N, RT-PCR of interferon-stimulated genes. O, Western blot of ERV sensors and interferon signaling pathway components. P, RT-PCR of Irf7 and Irf9. Q, Western blot of ERV sensors and interferon signaling pathway components. R, Enrichment of cancer testis antigen genes. *, P < 0.05; **, P < 0.01; ***, P < 0.001; ****, P < 0.0001. NS, not significant.

