
Figure 7.
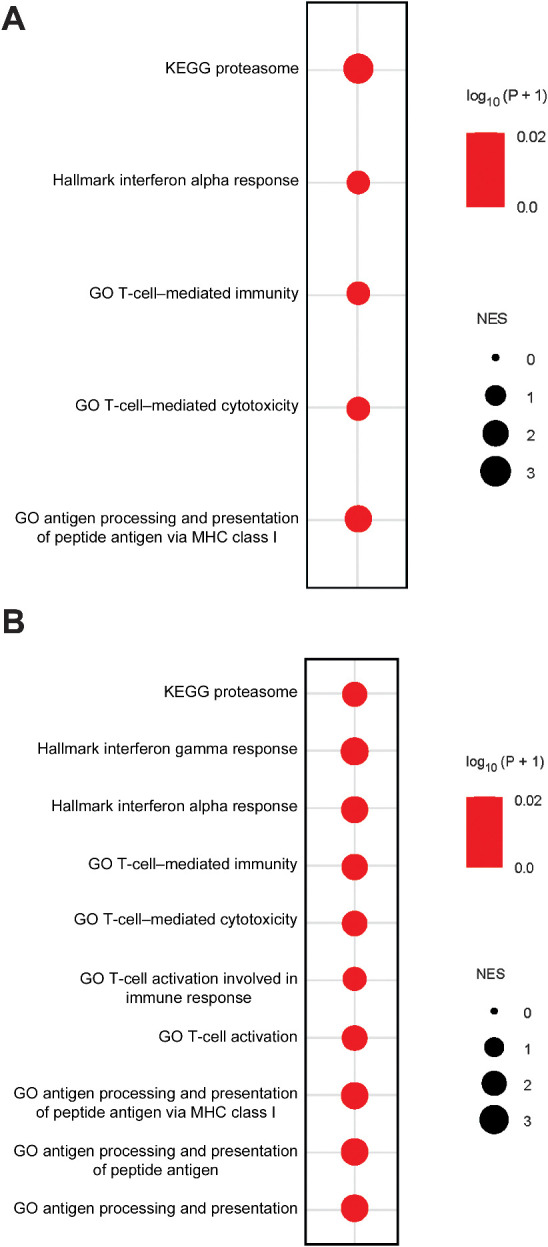
Low ATFIP or SETDB1 expression is associated with the hot tumor immune microenvironment in patients with cancer. A, Bubble plot showing multiple GSEA of the indicated pathways in a pan-cancer analysis of the TCGA dataset. NES >0: The gene set is enriched in ATF7IP low–expressing cancer samples (bottom 25%) compared with ATF7IP high–expressing cancer samples (top 25%). B, Bubble plot showing multiple GSEA of the indicated pathways in a pan-cancer analysis of the TCGA dataset. NES >0: The gene set is enriched in SETDB1 low–expressing cancer samples (bottom 25%) compared with SETDB1 high–expressing cancer samples (top 25%).