. 2021 Jul 6;11(12):3090–3105. doi: 10.1158/2159-8290.CD-20-1741

Figure 6.

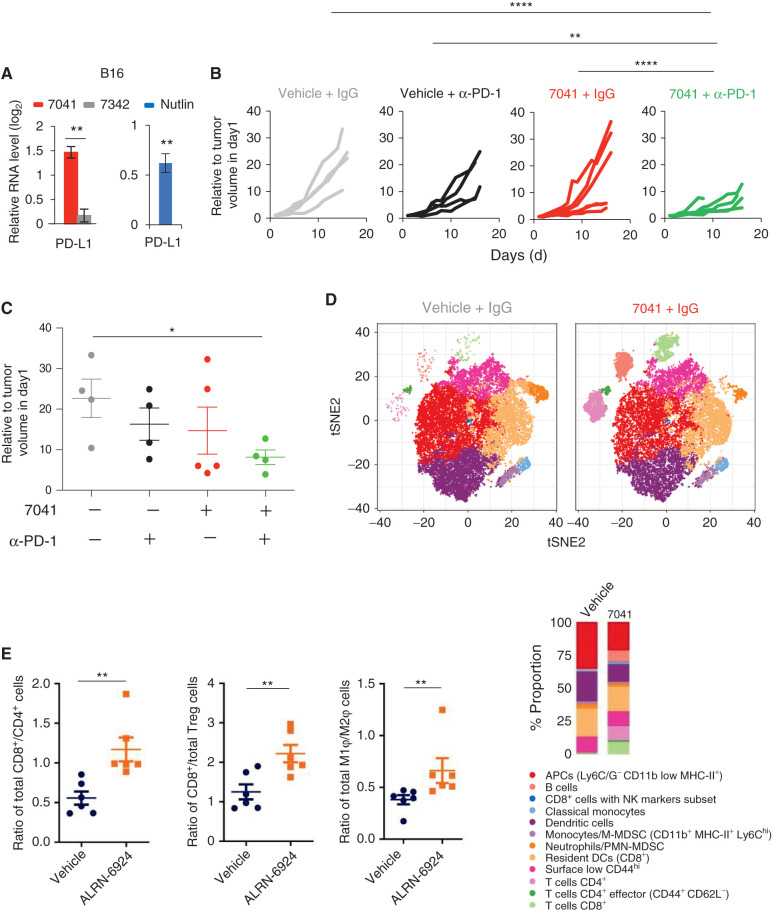
Figure 6. Pharmacologic reactivation of p53 enhanced T-cell infiltration and overcame tumor resistance to PD-1 blockade in vivo. A, Upregulation of PD-L1 expression upon p53 activation by 7041 or nutlin in B16 melanoma, as assayed by qPCR (n = 3). B and C, Tumor growth (B) and endpoint tumor volume (C) of B16 tumors grown in immunocompetent mice treated with vehicle, 7041, anti–PD-1 antibody, or 7041/anti–PD-1 combination. D, tSNE plot depicting 12 identified immune cell populations (panel below). Each plot represents the merged population of two different tumors per treatment. Bar plots are showing the differential proportion of each cell population in tumors treated with vehicle or 7041. E, Increased infiltration of cytotoxic CD8+ T cells and tumor-suppressive M1 macrophages in vivo in colon carcinoma model Colon26 upon treatment with stapled peptide MDM2 inhibitor ALRN-6924, as assessed by flow cytometry. Data are presented as a ratio representing total cell counts where Student t tests (A, E) and one-way ANOVA with Bonferroni correction (C). Error bars, SD. *, P < 0.05; **, P < 0.01.

Pharmacologic reactivation of p53 enhanced T-cell infiltration and overcame tumor resistance to PD-1 blockade in vivo. A, Upregulation of PD-L1 expression upon p53 activation by 7041 or nutlin in B16 melanoma, as assayed by qPCR (n = 3). B and C, Tumor growth (B) and endpoint tumor volume (C) of B16 tumors grown in immunocompetent mice treated with vehicle, 7041, anti–PD-1 antibody, or 7041/anti–PD-1 combination. D, tSNE plot depicting 12 identified immune cell populations (panel below). Each plot represents the merged population of two different tumors per treatment. Bar plots are showing the differential proportion of each cell population in tumors treated with vehicle or 7041. E, Increased infiltration of cytotoxic CD8+ T cells and tumor-suppressive M1 macrophages in vivo in colon carcinoma model Colon26 upon treatment with stapled peptide MDM2 inhibitor ALRN-6924, as assessed by flow cytometry. Data are presented as a ratio representing total cell counts where Student t tests (A, E) and one-way ANOVA with Bonferroni correction (C). Error bars, SD. *, P < 0.05; **, P < 0.01.