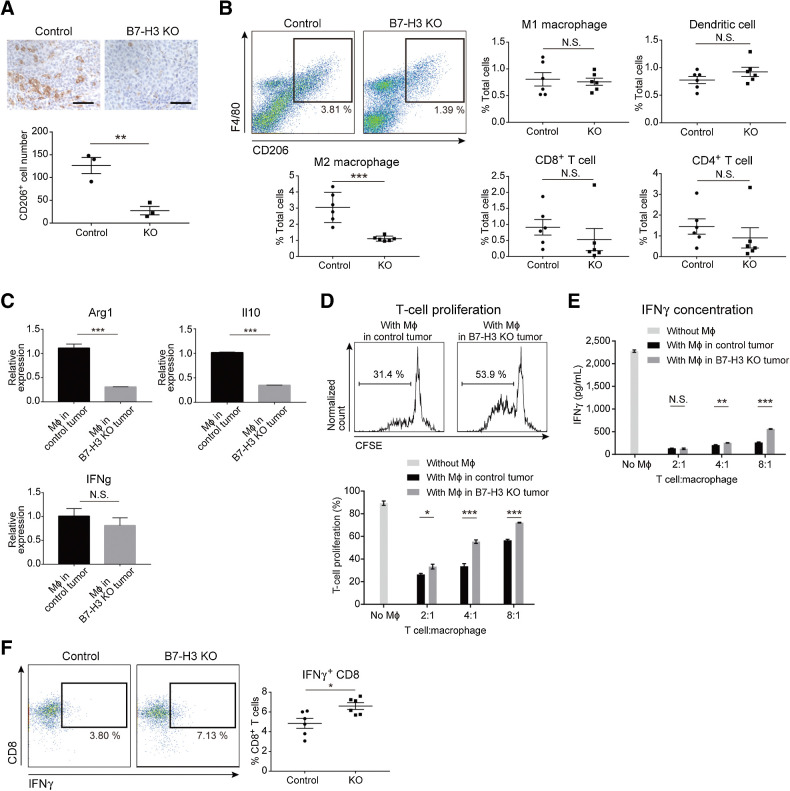
Figure 3.
B7-H3 suppression in tumor cells decreases the number of intratumoral M2 macrophages and increases IFNγ production of CD8+ T cells. A, IHC of CD206 in the B7-H3 KO intradermal HM-1 tumors and controls (n = 3). CD206+ cells were stained brown. Scale bar, 50 μm. B, Flow cytometry of immune cells from HM-1 tumors. Density plots (top left) show the M2 macrophages at day 12. Each dot represents live CD45+ cells, and the boxed area represents F4/80+CD206+ M2 macrophages. The percentage of positive cells relative to the total cells is plotted (n = 6). C, qPCR for the indicated genes in F4/80+ macrophages (Mϕ) isolated from the HM-1 intradermal tumors (n = 5). D, T-cell proliferation in presence of HM-1 tumor–derived macrophages. Top histograms show the percentage of proliferating T cells cocultured (4:1) with macrophages from control or B7-H3 KO tumors. Bottom bar graph shows the percentage of proliferating T cells cocultured with various ratios of macrophages (n = 5). E, IFNγ levels in the supernatants of cocultures in D (n = 5). F, Flow cytometry of IFNγ+CD8+ T cells from HM-1 tumors. Each dot represents live CD45+CD3+ cells, and the boxed area represents IFNγ+CD8+ T cells. The percentage of IFNγ+CD8+ T cells relative to total CD8+ T cells is plotted (n = 6). A–F, Data are presented as the mean ± SEM; *, P < 0.05; **, P < 0.01; ***, P < 0.001; N.S., not significant, unpaired t test.

