. 2021 Dec 21;10(2):182–199. doi: 10.1158/2326-6066.CIR-21-0124

Figure 1.

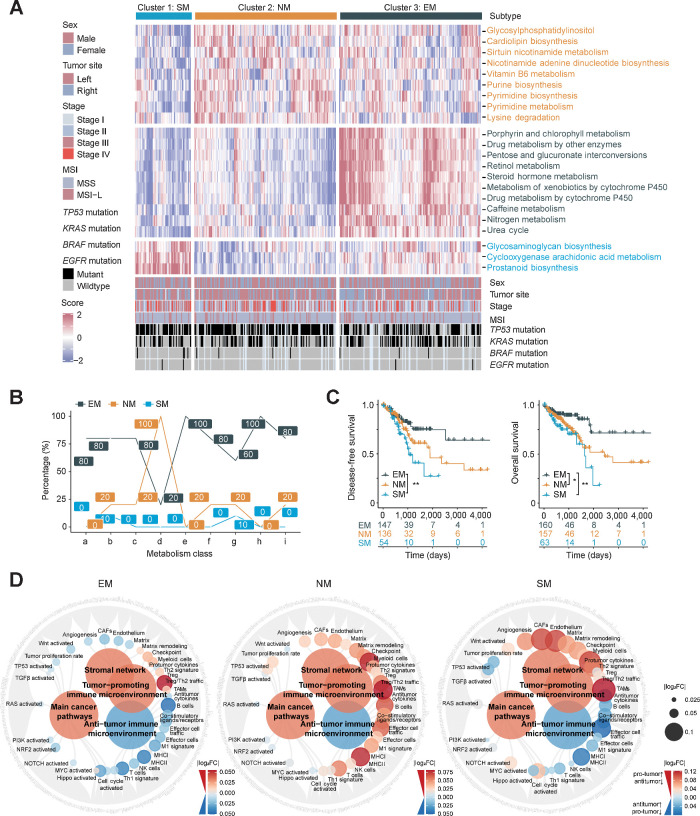
Figure 1. Comprehensive transcriptomic metabolism pathway-based clustering in MSS colorectal cancer. A, Metabolic pathway scores and unsupervised k-means clustering were performed in TCGA colorectal cancer cohort (n = 472). Patients with MSS colorectal cancer (n = 383) were filtered and three metabolic subtypes are shown with the specifically upregulated metabolic pathways. B, The proportions (%) of significantly upregulated pathways (log2 FC > 0, FDR < 0.05) in each metabolism categories among metabolic subtypes (a, Carbohydrate metabolism; b, Lipid metabolism; c, Amino acid metabolism; d, NM; e, EM; f, Metabolism of other amino acids; g, Glycan biosynthesis and metabolism; h, Xenobiotics biodegradation and metabolism; i, Metabolism of cofactors and vitamins). C, Kaplan–Meier plot showing DFS (left) and OS (right) among metabolic subtypes. P value was evaluated by log-rank test. D, Molecular function portrait (including oncogenic pathways, pro- and anti-TME factors and stromal network) based on ssGSEA score difference among subtypes (EM vs. Others, NM vs. Others, SM vs. Others). Antitumor effect is marked with blue and protumor factors with red, and the absolute value of log2 FC was shown with color and size changes. **, P < 0.01; *, P < 0.05.

Comprehensive transcriptomic metabolism pathway-based clustering in MSS colorectal cancer. A, Metabolic pathway scores and unsupervised k-means clustering were performed in TCGA colorectal cancer cohort (n = 472). Patients with MSS colorectal cancer (n = 383) were filtered and three metabolic subtypes are shown with the specifically upregulated metabolic pathways. B, The proportions (%) of significantly upregulated pathways (log2 FC > 0, FDR < 0.05) in each metabolism categories among metabolic subtypes (a, Carbohydrate metabolism; b, Lipid metabolism; c, Amino acid metabolism; d, NM; e, EM; f, Metabolism of other amino acids; g, Glycan biosynthesis and metabolism; h, Xenobiotics biodegradation and metabolism; i, Metabolism of cofactors and vitamins). C, Kaplan–Meier plot showing DFS (left) and OS (right) among metabolic subtypes. P value was evaluated by log-rank test. D, Molecular function portrait (including oncogenic pathways, pro- and anti-TME factors and stromal network) based on ssGSEA score difference among subtypes (EM vs. Others, NM vs. Others, SM vs. Others). Antitumor effect is marked with blue and protumor factors with red, and the absolute value of log2 FC was shown with color and size changes. **, P < 0.01; *, P < 0.05.