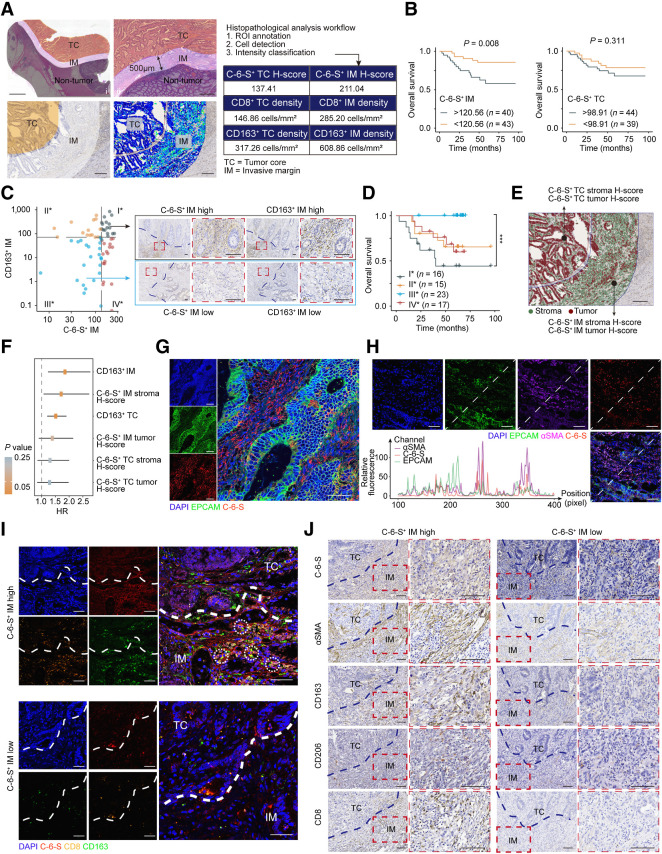
Figure 3.
An “exclusion barrier” was constructed by C-6-S and M2 macrophages in MSS CRC invasive margin. A, Schematic of digital pathology analysis. Left: i, Manual delineation of TC and IM. ii, Enlarged images of TC and IM region. iii-iv, Region delineation (iii) and digital identification of cell structure and stain intensity (iv). Right: Example of digital pathology analysis workflow and output. Scale bar: 2 mm in (i), 500 μm in (ii) and 200 μm for (iii) and (iv). B, Kaplan–Meier plots for the 5-year survival of MSS colorectal cancer in C-6-S+IM or C-6-S+TC low/high subgroups. The survminer R package determined the optimal cutoffs. P value was determined by log-rank test. C and D, Left, patients were grouped by C-6-S+ IM and CD163+ IM optimal cutoffs for OS. Right, representative IHC images of group I* and III* (C). Scale bar: 100μm. Overall survival (D) of four subgroups is shown. P value was determined by Log-rank test. E and F, Recognition of tumor and stroma cells using QuPath software and the H-score of C-6-S+ stroma and C-6-S+ tumor in IM and TC (E). Scale bar: 200 μm. Univariate Cox regression analysis for 5-year OS (F). The HR and 95% confidence intervals are shown. IF detected EPCAM and C-6-S (G) or EPCAM, αSMA and C-6-S (H) in human colorectal cancer specimens. Nuclei are shown in blue (DAPI). EPCAM (tumor cell marker) is in green, αSMA (CAF marker) is in purple and C-6-S is in red. The fluorescent intensity at each position along the indicated diagonal were quantified (H, bottom left). Scale bar: 50 μm. I, IF assay with C-6-S (red), CD8 (orange), and CD163 (green) in IM and TC regions. White circles highlight the adjacent position of CD8+ T cells (CD8) and M2 macrophages (CD163). Scale bar: 50 μm. J, Representative IHC images displaying the differential expression of C-6-S, αSMA, CD163, CD206 and CD8 in C-6-S+ IM stroma, stratified by H-score high/low groups. Scale bar: 100 μm. ***, P < 0.001.

