. 2021 Dec 21;10(2):182–199. doi: 10.1158/2326-6066.CIR-21-0124

Figure 4.

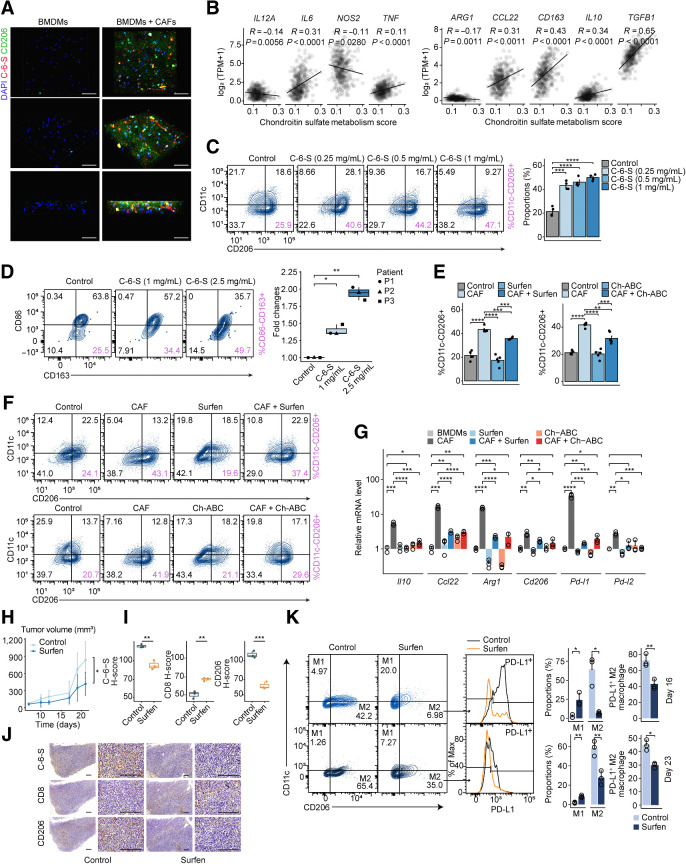
Figure 4. CAF-derived C-6-S induces M2 macrophage polarization and causes immune exclusion. A, IF staining showing C-6-S in ECM and CD206 in BMDMs colcultured with CAFs in a 3D system. Nuclei are shown in blue (DAPI), CD206 (M2-type marker) is in green, and C-6-S is in red. Scale bar: 50 μm. B, The correlation between CS metabolism ssGSEA scores and M1-type markers (left), M2-type markers (right) in TCGA MSS colorectal cancer cohort. Mouse PMs (C) and human colorectal cancer TAMs (D) were treated with various concentrations of C-6-S. Flow cytometry detected the CD11c−CD206+ or CD86−CD163+ M2 macrophages. Bar graphs or boxplot show the summarized data. Student t test was used to calculate P values. Mouse PMs with or without CAF cocultivation and CS antagonists (Surfen and Ch-ABC) were detected with flow cytometry (E and F) and BMDMs were detected with qPCR (G). H–K, CT26 tumor–bearing mice were randomized to control or Surfen group (n = 5 for each group). Tumor growth curves from day 0–21, and P value by Student t test on day 21 (H). Representative IHC images of C-6-S, CD8, and CD206 in each group on day 16 (J), along with statistical plots (I). Scale bar: 200 μm. On day 16 (top) and day 23 (bottom), macrophages isolated from each group were analyzed for CD11c, CD206, and PD-L1 expression, and the M1/M2 type and PD-L1+ proportions were summarized (K). Statistics were calculated with 3 (D and G), 4 (C), or 5 (E) samples. Student t test was performed in C–E, G, I, and K. Data are presented as mean ± SD. ****, P < 0.0001; ***, P < 0.001; **, P < 0.01; *, P < 0.05; ns, P > 0.05.

CAF-derived C-6-S induces M2 macrophage polarization and causes immune exclusion. A, IF staining showing C-6-S in ECM and CD206 in BMDMs colcultured with CAFs in a 3D system. Nuclei are shown in blue (DAPI), CD206 (M2-type marker) is in green, and C-6-S is in red. Scale bar: 50 μm. B, The correlation between CS metabolism ssGSEA scores and M1-type markers (left), M2-type markers (right) in TCGA MSS colorectal cancer cohort. Mouse PMs (C) and human colorectal cancer TAMs (D) were treated with various concentrations of C-6-S. Flow cytometry detected the CD11cCD206+ or CD86CD163+ M2 macrophages. Bar graphs or boxplot show the summarized data. Student t test was used to calculate P values. Mouse PMs with or without CAF cocultivation and CS antagonists (Surfen and Ch-ABC) were detected with flow cytometry (E and F) and BMDMs were detected with qPCR (G). H–K, CT26 tumor–bearing mice were randomized to control or Surfen group (n = 5 for each group). Tumor growth curves from day 0–21, and P value by Student t test on day 21 (H). Representative IHC images of C-6-S, CD8, and CD206 in each group on day 16 (J), along with statistical plots (I). Scale bar: 200 μm. On day 16 (top) and day 23 (bottom), macrophages isolated from each group were analyzed for CD11c, CD206, and PD-L1 expression, and the M1/M2 type and PD-L1+ proportions were summarized (K). Statistics were calculated with 3 (D and G), 4 (C), or 5 (E) samples. Student t test was performed in CE, G, I, and K. Data are presented as mean ± SD. ****, P < 0.0001; ***, P < 0.001; **, P < 0.01; *, P < 0.05; ns, P > 0.05.