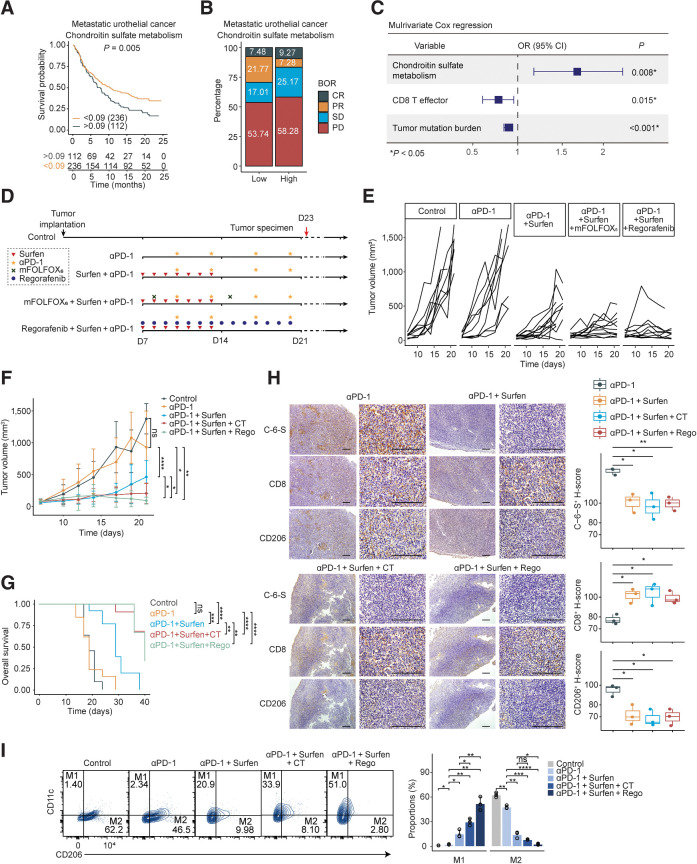
Figure 6.
Blockade of C-6-S enhances the anti–PD-1 response of MSS colorectal cancer in vivo. A–C, The predictive value of CS metabolism pathway ssGSEA score for immunotherapy efficacy and patients' survival in urothelial cancer cohort from Mariathasan and colleagues (17). A, Kaplan–Meier survival curves for patients with high/low CS metabolism score. The optimal cutoff of continuous variables was defined by survminer R package. B, Bar plots presenting the ICIs response stratified by the median CS metabolism pathway score. C, Multivariate Cox logistic regression analysis with PR/CR and SD/PD as binary outcome. D, The in vivo experiment overview. Mice subcutaneous tumor model was established using CT26 colon cancer cell line. On day 7 after tumor implantation, the mice were randomized into five groups (control, anti–PD-1, Surfen+anti–PD-1, mFOLFOX6+Surfen+anti–PD-1, Regorafenib+Surfen+anti–PD-1, n = 11–13 for each group). E and F, Tumor growth curves on days 0–21 (E) and intergroup difference analysis on day 19 or 21 (F). G, The overall survival of mice in each group up to day 40. The endpoint was established at tumor volume ≥ 1,000 mm3. H, Subcutaneous tumor IHC of C-6-S, CD8, and CD206 in experimental groups on day 23. Statistical analyses are shown on the right. Scale bar: 200 μm. I, On day 23, macrophages isolated from each group were detected for M1 and M2-type markers by flow cytometry. CT, chemotherapy regimen, mFOLFOX6; Rego, Regorafenib. Statistics were calculated with three samples (H and I). Student t test was performed in F, H, and I. Log-rank test was performed in G. Data are presented as mean ± SD. ****, P < 0.0001; ***, P < 0.001; **, P < 0.01; *, P < 0.05; ns, P > 0.05.

