Figure 5.
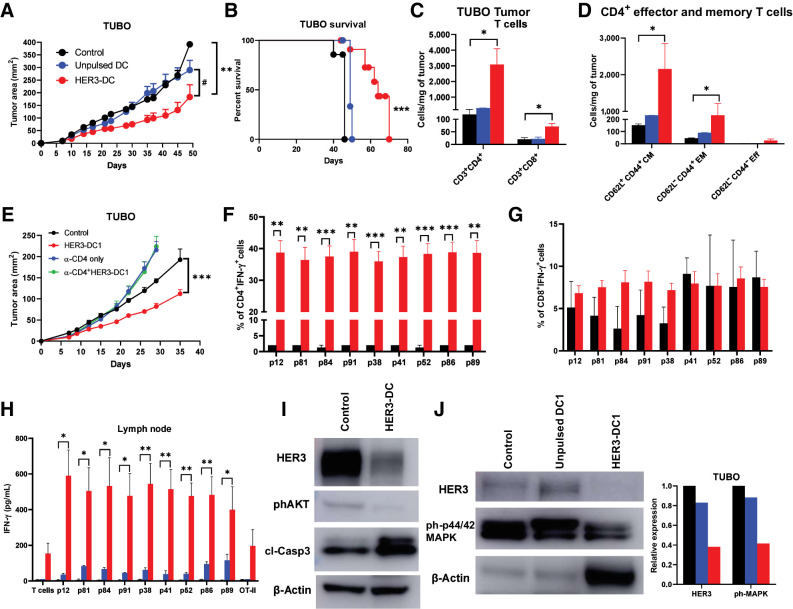
Intratumoral HER3-DC1 delays tumor growth and enhances immune infiltration in a HER2pos TUBO therapeutic model in a CD4-dependent manner. A, Tumor growth in the TUBO murine mammary carcinoma model. BALB/c mice were injected with TUBO tumor cells, and on day 7, mice received either PBS control (black), unpulsed mature DC1 (blue), or HER3-DC1 (red) intratumorally once weekly for six doses (n = 10 mice/group). Tumor growth was monitored until endpoint and compared in control versus HER3-DC1 (*) and unpulsed DC1 versus HER3-DC1 (#) mice. B, Percent survival in TUBO mouse model. Control: black; unpulsed DC1: blue; HER3-DC1: red. C, CD3+CD4+ and CD3+CD8+ T cells per milligram of tumors from mice (A) after intratumoral DC injection was compared between control (black) and HER3-DC1 (red) groups. No statistical analyses were performed for the unpulsed DC1 (blue) mice (n = 3/group). D, Abundance of CD4+ central memory (CD62L+CD44+ CM), effector memory (CD62L−CD44+ EM), and effector (CD62L−CD44− Eff) T cells in control (black) versus HER3-DC1 mice (red) per milligram of tumor tissue. Data shown are the representative from three independent experiments. E, Tumor growth of TUBO tumors after CD4 depletion. BALB/c mice were injected with anti-CD4 antibodies 3 days before subcutaneous TUBO tumor injection. When tumors were palpable, mice received either PBS control (black), intratumoral HER3-DC1 once weekly (red) for six doses, CD4 depletion antibody alone (blue; continued twice weekly until endpoint), or HER3-DC1 (green) with CD4 depletion. Tumor growth was monitored until endpoint. F and G, Percentage of CD4+IFN-γ+ (F) and CD8+IFN-γ+ (G) TILs in the tumors from control (black) versus HER3-DC1 (red) mice from E. H, Coculture of the lymph node immune cells with HER3 peptide–pulsed DC1 for 72 hours to detect IFN-γ via ELISA. Control: black bar; unpulsed DC1: blue bar; HER3-DC1: red bar. I, Western blot for HER3, phosphorylated AKT (phAKT), and cleaved caspase-3 (clCasp-3) with total protein isolated from control- and HER3-DC1–treated TUBO tumors. β-Actin: loading control. J, Western blot for HER3 and phosphorylated p44/42 MAPK (ph-p44/42 MAPK) from control-, unpulsed DC1–, and HER3-DC1–treated TUBO tumors. β-Actin: loading control. Data represented as mean ± SEM with statistical significance determined using multiple t test without correction for multiple comparisons. Each row was analyzed individually, without assuming a consistent SD. A log-rank (Mantel–Cox) test was used to determine differences between the survival curves. *, P ≤ 0.05; **, P ≤ 0.01; ***, P ≤ 0.001; #, P ≤ 0.01.

