. 2021 Nov 16;10(1):108–125. doi: 10.1158/2326-6066.CIR-21-0454

Figure 6.

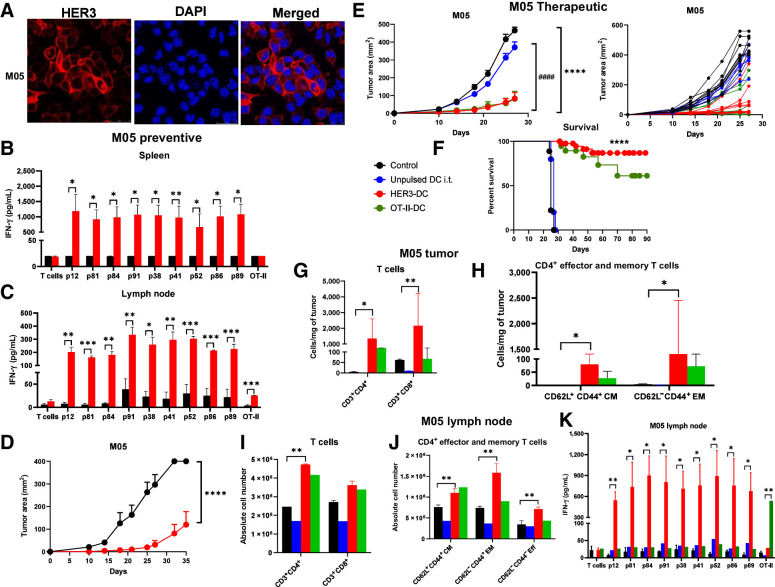
Figure 6. Vaccination prevents tumor development in a preventive HER3+ melanoma model and diminishes tumor growth and improves survival in a therapeutic HER3+ melanoma model. A, Immunofluorescence for HER3 (red) surface expression in M05 cells. DAPI (blue): nucleus (image magnification: 1,200×). B, HER3 peptide–specific immune responses (n = 3–5/group). Splenocytes from control (black) and vaccinated (red) mice were restimulated with individual HER3 peptides for 72 hours to detect IFN-γ by ELISA. C, Lymph node lymphocytes from control (black) and HER3-DC1 (red) vaccinated mice were cocultured with individual HER3 peptide–pulsed DCs to detect antigen-specific immune response in HER3-DC1 vaccinated mice by ELISA. D, Preventive model: Two weeks after the last vaccine, C57BL/6 mice (n = 10 mice/group) were challenged with M05 tumor cells. Tumor growth was monitored until endpoint in control (black) versus HER3-DC1 vaccinated (red) mice. E, Therapeutic setting: C57BL/6 mice were injected subcutaneously with the M05 murine melanoma cells in the left flank, and upon palpable tumor formation on day 10, mice were randomized into four groups (n = 10 mice/group). Tumor growth was monitored in mice receiving PBS (black), unpulsed DC1 (blue), HER3-DC1 (red), and OT-II peptide–pulsed DC1 (green) intratumorally once weekly for 6 weeks. Tumor growth was compared between control and HER3-DC1 (*) and unpulsed DC1 vs. HER3-DC1 (#) groups. Individual tumor growth curve for each mouse shown on the right. F, Percent survival in M05 mouse model for control (black)-, unpulsed DC1 (blue)–, HER3-DC1 (red)–, and OT-II-DC1 (green)–treated mice. G, Intratumoral infiltration of CD3+CD4+ and CD3+CD8+ T cells was compared between control (black) and HER3-DC1 (red) mice from E. H, CD4+ central memory (CD62L+CD44+ CM) and effector memory (CD62L−CD44+ EM) T-cell infiltration per milligram of tumors in control (black) versus HER3-DC1 (red) mice from E. I, Absolute number of CD3+CD4+ and CD3+CD8+ T cells in the lymph nodes of control- versus HER3-DC1–treated mice from E. J, Abundance of CD4+ CM, EM, and effector (Eff) T cells in the lymph nodes of control versus treated mice. For G–J, Unpulsed DC1 (blue) and OT-II-DC1 (green) groups were not included in the statistical analyses. K, Lymph node lymphocytes from control and treated mice (E) were cocultured with individual HER3 peptide–pulsed DC1 for 72 hours to detect IFN-γ by ELISA. Responses were compared between control and HER3-DC1 groups for HER3 peptides, and control versus OT-II-DC1 groups to OT-II peptide–pulsed DCs. Data shown are the representative from three independent experiments and are represented as mean ± SEM with statistical significance determined using multiple t test without correction for multiple comparisons. Each row was analyzed individually, without assuming a consistent SD. A log-rank (Mantel–Cox) test was used to determine differences between the survival curves. *, P ≤ 0.05; **, P ≤ 0.01; ***, P ≤ 0.001; ****, P ≤ 0.0001; ####, P ≤ 0.0001.

Vaccination prevents tumor development in a preventive HER3+ melanoma model and diminishes tumor growth and improves survival in a therapeutic HER3+ melanoma model. A, Immunofluorescence for HER3 (red) surface expression in M05 cells. DAPI (blue): nucleus (image magnification: 1,200×). B, HER3 peptide–specific immune responses (n = 3–5/group). Splenocytes from control (black) and vaccinated (red) mice were restimulated with individual HER3 peptides for 72 hours to detect IFN-γ by ELISA. C, Lymph node lymphocytes from control (black) and HER3-DC1 (red) vaccinated mice were cocultured with individual HER3 peptide–pulsed DCs to detect antigen-specific immune response in HER3-DC1 vaccinated mice by ELISA. D, Preventive model: Two weeks after the last vaccine, C57BL/6 mice (n = 10 mice/group) were challenged with M05 tumor cells. Tumor growth was monitored until endpoint in control (black) versus HER3-DC1 vaccinated (red) mice. E, Therapeutic setting: C57BL/6 mice were injected subcutaneously with the M05 murine melanoma cells in the left flank, and upon palpable tumor formation on day 10, mice were randomized into four groups (n = 10 mice/group). Tumor growth was monitored in mice receiving PBS (black), unpulsed DC1 (blue), HER3-DC1 (red), and OT-II peptide–pulsed DC1 (green) intratumorally once weekly for 6 weeks. Tumor growth was compared between control and HER3-DC1 (*) and unpulsed DC1 vs. HER3-DC1 (#) groups. Individual tumor growth curve for each mouse shown on the right. F, Percent survival in M05 mouse model for control (black)-, unpulsed DC1 (blue)–, HER3-DC1 (red)–, and OT-II-DC1 (green)–treated mice. G, Intratumoral infiltration of CD3+CD4+ and CD3+CD8+ T cells was compared between control (black) and HER3-DC1 (red) mice from E. H, CD4+ central memory (CD62L+CD44+ CM) and effector memory (CD62LCD44+ EM) T-cell infiltration per milligram of tumors in control (black) versus HER3-DC1 (red) mice from E. I, Absolute number of CD3+CD4+ and CD3+CD8+ T cells in the lymph nodes of control- versus HER3-DC1–treated mice from E. J, Abundance of CD4+ CM, EM, and effector (Eff) T cells in the lymph nodes of control versus treated mice. For GJ, Unpulsed DC1 (blue) and OT-II-DC1 (green) groups were not included in the statistical analyses. K, Lymph node lymphocytes from control and treated mice (E) were cocultured with individual HER3 peptide–pulsed DC1 for 72 hours to detect IFN-γ by ELISA. Responses were compared between control and HER3-DC1 groups for HER3 peptides, and control versus OT-II-DC1 groups to OT-II peptide–pulsed DCs. Data shown are the representative from three independent experiments and are represented as mean ± SEM with statistical significance determined using multiple t test without correction for multiple comparisons. Each row was analyzed individually, without assuming a consistent SD. A log-rank (Mantel–Cox) test was used to determine differences between the survival curves. *, P ≤ 0.05; **, P ≤ 0.01; ***, P ≤ 0.001; ****, P ≤ 0.0001; ####, P ≤ 0.0001.