. 2021 May 27;11(11):2812–2827. doi: 10.1158/2159-8290.CD-21-0007

Figure 2.

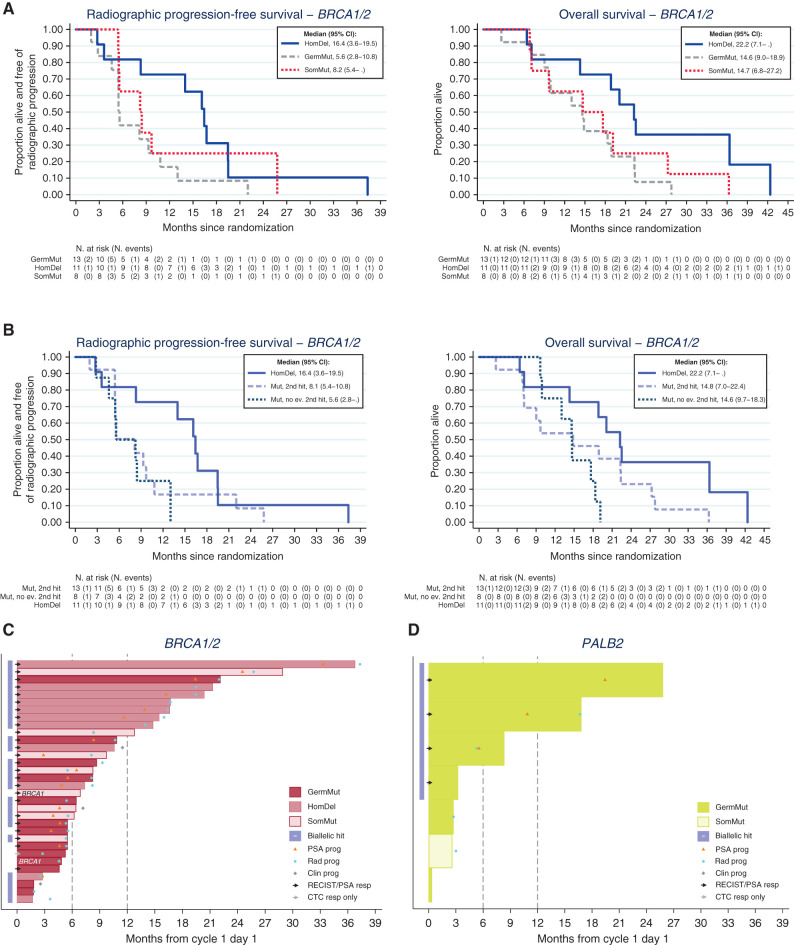
Figure 2. Outcomes with olaparib in the BRCA1/2 and PALB2 cohorts. A, Kaplan–Meier curves showing rPFS and OS in BRCA1/2 cohort depicting homozygous deletions, germline and somatic mutations: Tumors with homozygous BRCA deletions have the best outcomes. B, Kaplan–Meier curves rPFS and OS in BRCA1/2 cohort depicting outcomes in homozygous deletions and mutated genes with or without a detectable second hit. C, Swimmer plots depicting time on treatment per origin/type alterations in BRCA1/2 patients. D, Swimmer plots depicting time on treatment per origin/type alterations in PALB2 patients.

Outcomes with olaparib in the BRCA1/2 and PALB2 cohorts. A, Kaplan–Meier curves showing rPFS and OS in BRCA1/2 cohort depicting homozygous deletions, germline and somatic mutations: Tumors with homozygous BRCA deletions have the best outcomes. B, Kaplan–Meier curves rPFS and OS in BRCA1/2 cohort depicting outcomes in homozygous deletions and mutated genes with or without a detectable second hit. C, Swimmer plots depicting time on treatment per origin/type alterations in BRCA1/2 patients. D, Swimmer plots depicting time on treatment per origin/type alterations in PALB2 patients.