. 2021 May 27;11(11):2812–2827. doi: 10.1158/2159-8290.CD-21-0007

Figure 3.

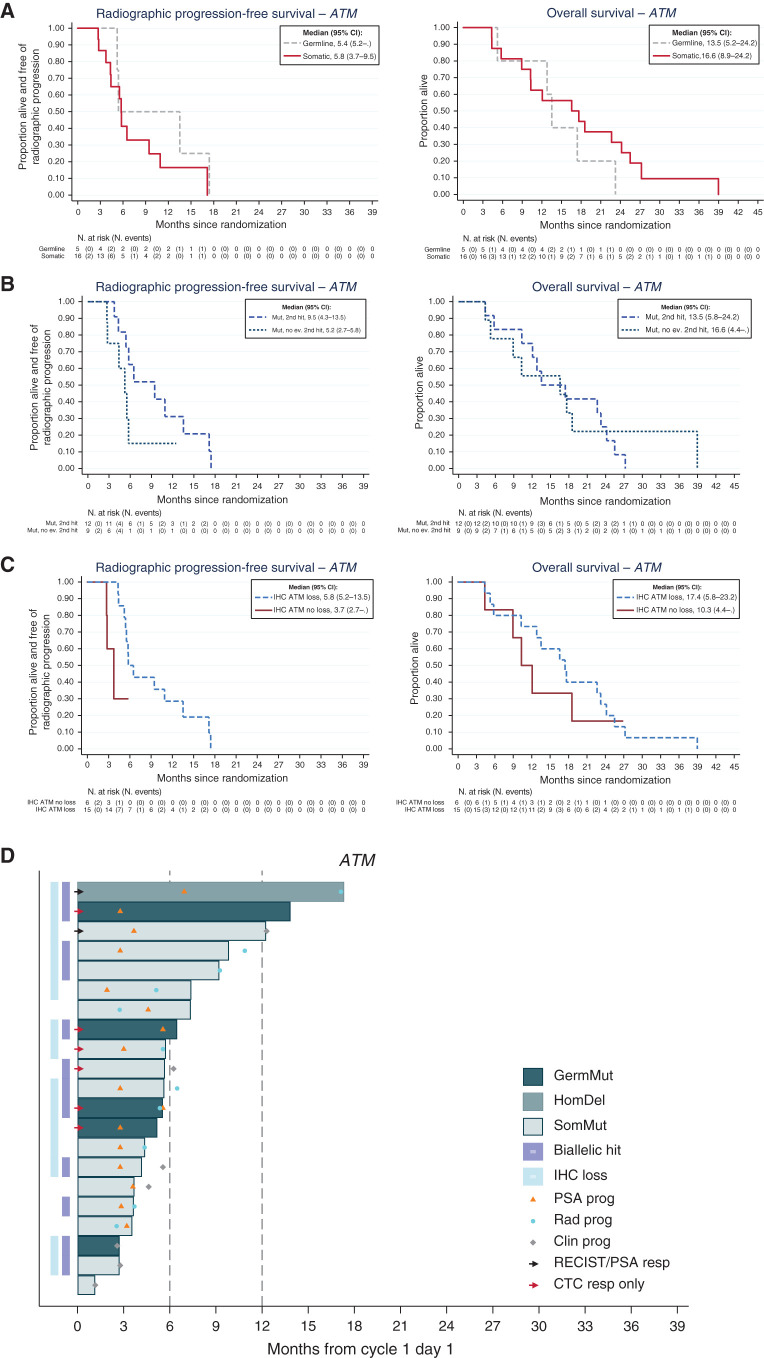
Figure 3. Outcomes with olaparib in ATM-altered prostate cancer indicating that complete ATM loss associates with better outcome on PARP inhibition. A, Kaplan–Meier curves depicting rPFS and OS outcomes in the prostate cancer cohort treated with olaparib and germline and somatic mutations. B, Kaplan–Meier curves depicting rPFS and OS outcomes with olaparib treatment in prostate cancers with and without second detectable genomic hits on the ATM gene. C, Kaplan–Meier curves depicting rPFS and OS outcomes in patients with prostate cancer treated with olaparib in the ATM cohort with and without ATM loss by IHC. D, Swimmer plots depicting time on treatment per origin/type alterations in the ATM gene.

Outcomes with olaparib in ATM-altered prostate cancer indicating that complete ATM loss associates with better outcome on PARP inhibition. A, Kaplan–Meier curves depicting rPFS and OS outcomes in the prostate cancer cohort treated with olaparib and germline and somatic mutations. B, Kaplan–Meier curves depicting rPFS and OS outcomes with olaparib treatment in prostate cancers with and without second detectable genomic hits on the ATM gene. C, Kaplan–Meier curves depicting rPFS and OS outcomes in patients with prostate cancer treated with olaparib in the ATM cohort with and without ATM loss by IHC. D, Swimmer plots depicting time on treatment per origin/type alterations in the ATM gene.