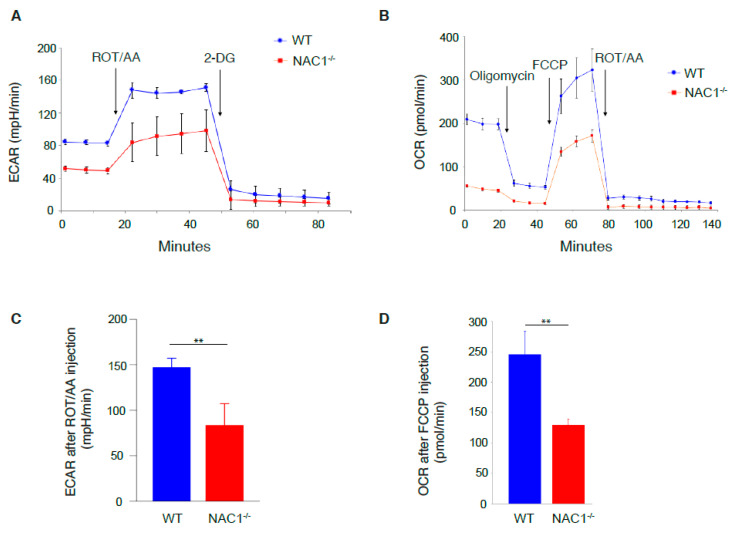
Figure 2.
Defects in glycolysis and oxidative phosphorylation rate of NAC1−/− CD8+ T cells. Cell metabolism was tested using the Agilent Seahorse Assay on day 3 after activation. (A,C) The cells were activated with coated anti-CD3 and soluble anti-CD28 Abs. Then, 2 × 10⁵ cells were plated in each well of seahorse microplate for glycolytic rate testing. The drugs were injected into each well at the time indicated in the figures. The Extra Cellular Acidification Rate (ECAR) was measured as a proxy for glycolytic rate. The ECAR level after ROT/AA injection was compared between WT and NAC1−/− groups. Sample numbers (n = 4), the p-value is 0.0076 (B,D). The activated 2 × 10⁵ T cells were seeded in a microplate before mitochondrial stress testing. The different drugs were added to the well according to the indicated time points. The Oxygen Consumption Rate (OCR) was tested as a proxy for oxidative phosphorylation. The OCR level was then compared after FCCP injection between the two groups. Sample numbers (n = 4), p-value is 0.0054 (**, p < 0.01).

