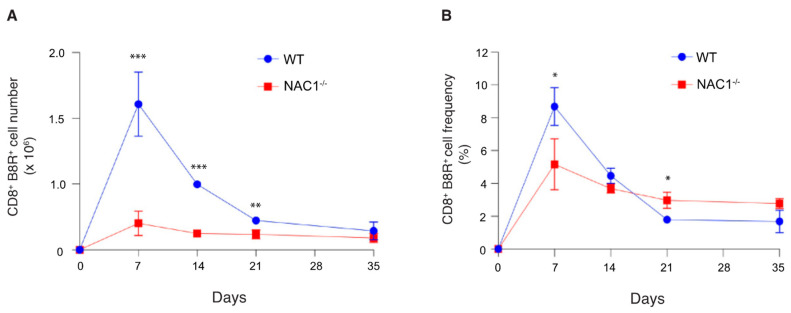
Figure 4.
Sustained VACV-specific CD8+ T cell survival in NAC1−/− mice. The VACV-specific CD8+ T cell number and cell frequency changed within 35 days post-infection. (A) Mice were challenged with VACV at 2 × 10⁶ PFU/mouse. The spleen and lymph nodes (superficial cervical, axillary, brachial, and inguinal nodes) were dissected and smashed. The total live cell number for each mouse was calculated with trypan blue staining using a Bio-Rad cell counter. T cells were stained with CD8 Ab and B8R tetramer and analyzed by flow cytometry. Total Ag-specific CD8+ T cells were calculated for each mouse (n = 5). The p-values are 0.00038 (day7), 8.2 × 10⁻⁵ (day 14), and 0.0066 (day 21). (B) The Ag-specific CD8+ T cell frequency was monitored for 35 days. P-values are 0.011 (day 7), and 0.016 (day 21). (*, p < 0.05; **, p < 0.01; ***, p < 0.001).

