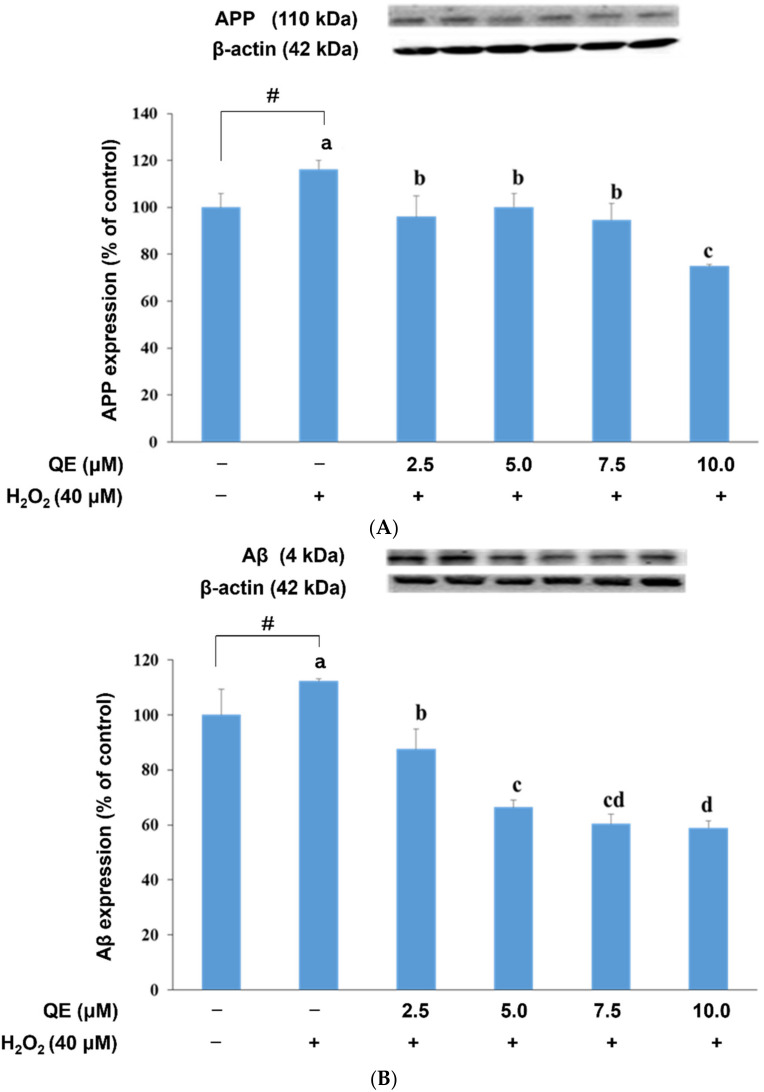
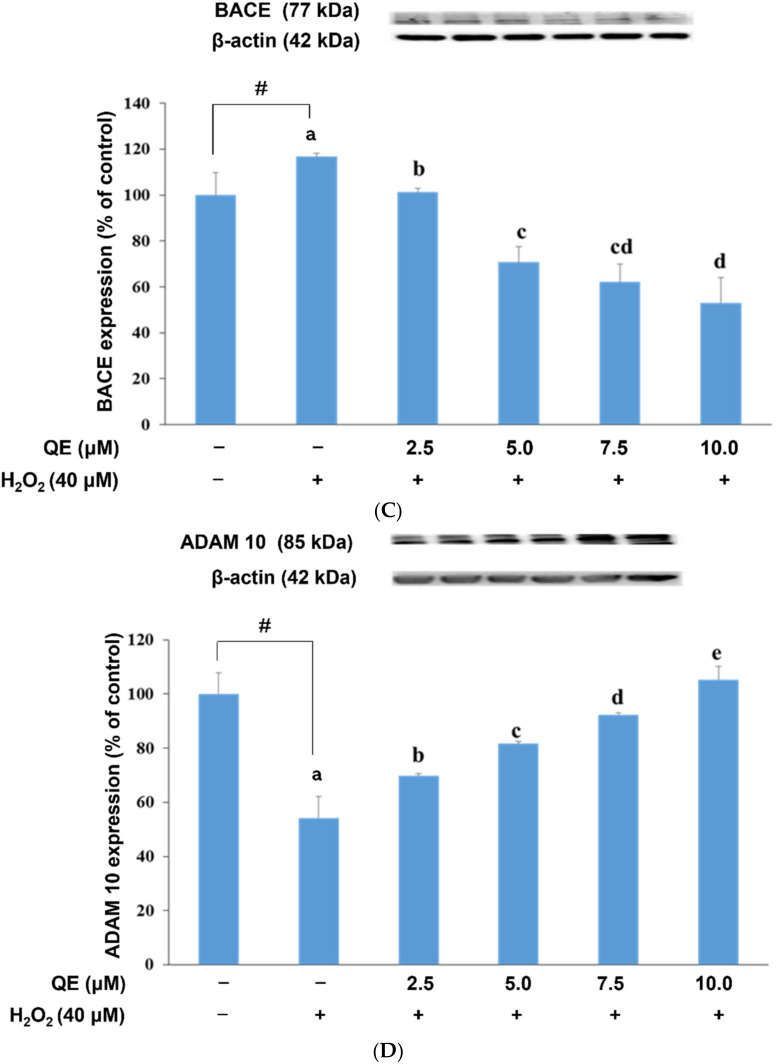
Figure 5.
Effects of quercetin and H2O2 on APP (A), Aβ (B), BACE-1 (C) and ADMA (D) protein expression. Data were presented as mean ± SD. # Data are analyzed using an independent t-test and are significantly different from the control group. Bars of 0, 2.5, 5.0, 7.5, and 10.0 μM quercetin with different letters significantly differ. Statistical analysis was performed using a one-way ANOVA, followed by a least significant difference post hoc test (n = 3).


