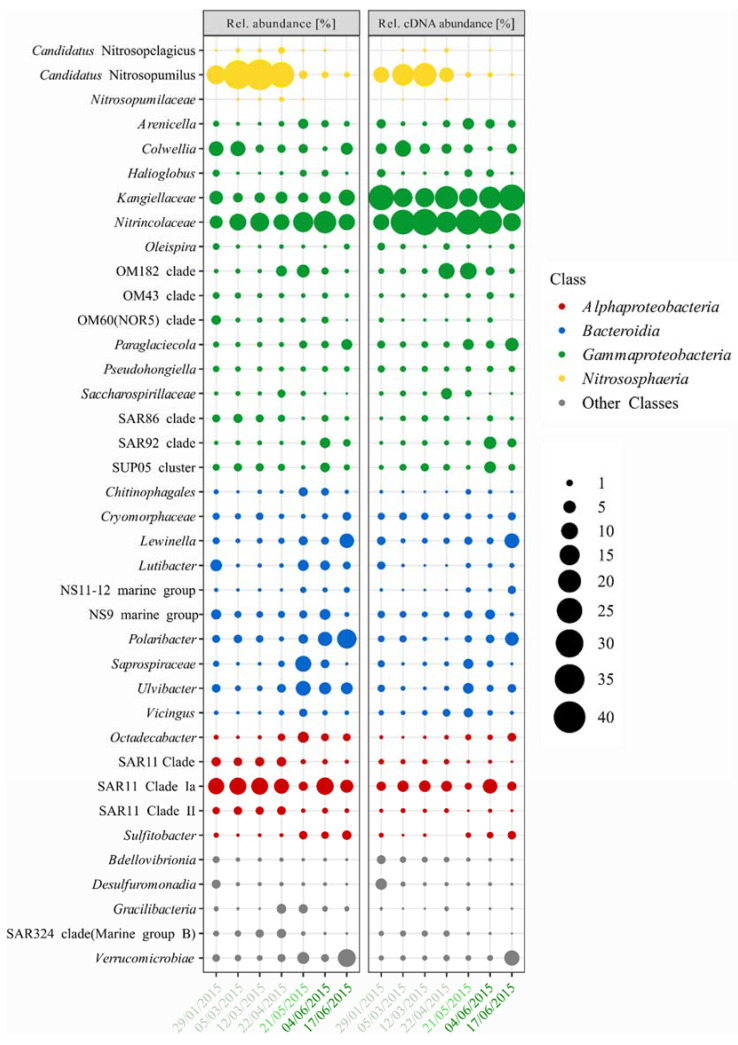
Figure 3.
Bubble plot of the most abundant bacterial and archaeal taxa during the N-ICE2015 expedition, which constitute at least 80% of the total community per sample. The plot shows the distribution of 16S rRNA genes (rel. abundance) and RNA the distribution of 16S rRNA copies (rel. cDNA abundance) of the different taxonomic groups. The color of the dates indicates the season (light green = winter, green = spring, and dark green = summer) and the ice algae bloom (dark green).

