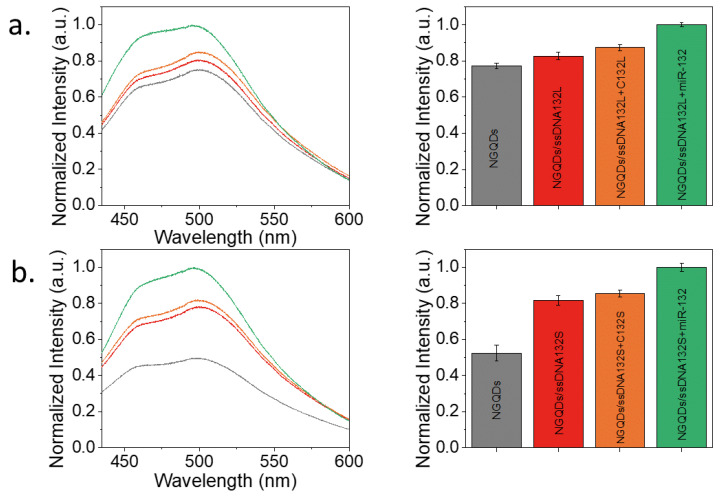
Figure 5.
The detection of loop (a) and stem (b) of pre-miR-132 and its ssDNA version. Fluorescence spectra of NGQDs (grey), NGQDs complexed with the bait for either the loop or stem ssDNA132L/S (red), NGQDs complexed with the loop or stem bait (ssDNA132L/S) mixed with their respective complementary ssDNA strands (C132L/S) (orange) or miR-132 (green). Corresponding integrated spectral intensities are shown as bar plots.

