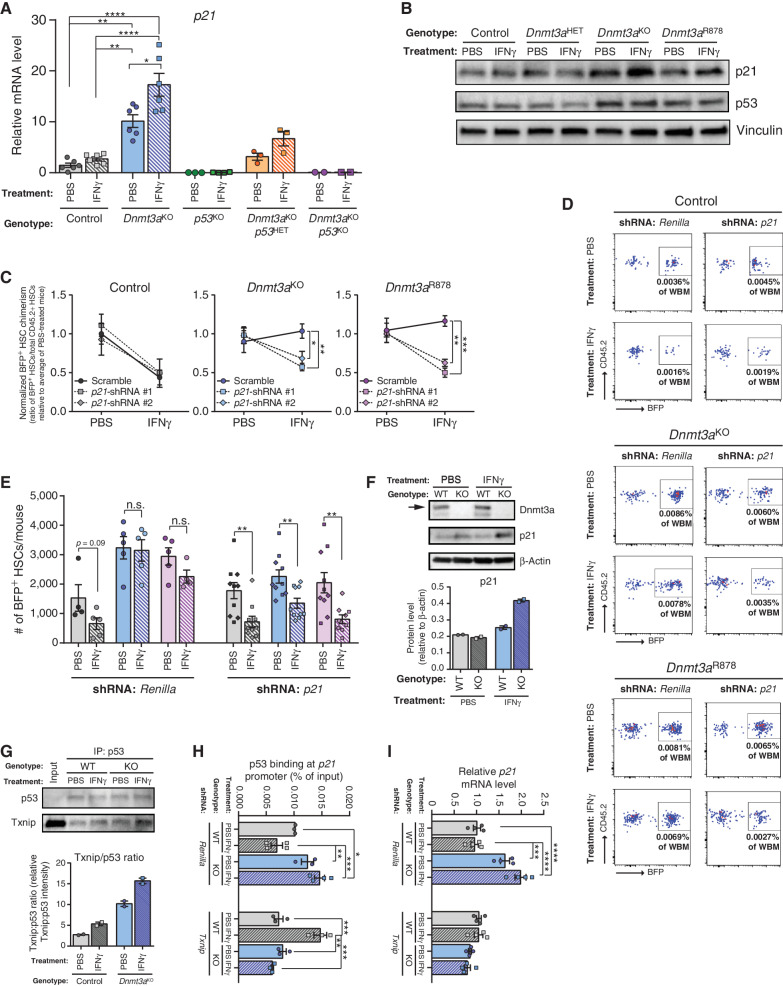
Figure 6.
Txnip upregulates p21 in Dnmt3a-mutant HSCs in response to IFNγ. A,p21 mRNA levels in HSCs (Lineage−c-Kit+EPCR+CD48−CD150+) from mice treated with PBS or IFNγ (two doses, cells purified 2 hours after the second dose) measured by qPCR (n = 2–6). B, Protein levels measured by Western blot in hematopoietic progenitor cells (Lineage−c-Kit+) from mice treated with PBS or IFNγ (two doses, cells purified 2 hours after the second dose). Representative of two independent experiments. C, Normalized level of BFP+ cell chimerism in donor-derived HSC (CD45.2+Lineage−c-Kit+EPCR+CD48−CD150+) pool 18 weeks posttransplant. Ratio for each mouse is normalized to average BFP+ HSC chimerism in PBS treatment for individual shRNAs for each genotype to account for differences in transduction efficiency (n = 4–5 per group). D, Representative flow cytometry plots from mice transplanted with shRNA-transduced hematopoietic progenitor cells. Plots show BFP+ HSC chimerism for each genotype and treatment from Lineage−c-Kit+EPCR+CD48−CD150+-gated BM. E, Number of BFP+ donor-derived HSCs (BFP+CD45.2+Lineage−c-Kit+EPCR+CD48−CD150+) in BM of recipients 18 weeks posttransplant. Data for two independent shRNAs targeting p21 are compiled, denoted by square (p21-shRNA #1) or diamond (p21-shRNA #2) shapes. F, Protein levels measured by western blot in 32D cells (WT = control; KO = Dnmt3aKO) following 24-hour IFNg (10 ng/mL) or PBS treatment. Arrow indicates full-length Dnmt3a. Representative of two independent experiments, quantification shown underneath. G, Western blot analysis of 32D cell lysate (treated with PBS or IFNg for 24h; WT = control, KO = Dnmt3aKO) following immunoprecipitation with p53 antibody. Representative of two independent experiments, quantification shown underneath. H, Chromatin-immunoprecipitation qPCR analysis of p53 enrichment at p21 promoter in 32D cells (WT = control, KO = Dnmt3aKO) transduced with shRNA targeting Renilla (control) or Txnip. Chromatin was isolated following a 24-hour exposure of IFNγ (10 ng/mL) or PBS (n = 3–4). I, qPCR for p21 expression levels in the same cells used in H. One-way ANOVA (A, C, H, I) or two-tailed t test (E, data are compared for IFNγ relative to PBS within each genotype/shRNA); *, P < 0.05; **, P < 0.01; ***, P < 0.001; ****, P < 0.0001. Data represent mean ± SEM.

